Hexed – Working effectively in the hex editor
I love my hex editor! I mean I really do. As reverse engineers and binary explorers, the hex editor is arguably the most used tool for human binary reconnaissance. From format exploration to file rebuilding, it's the best utility in our toolkit with a great legacy of its own. From the diverse range of editors to the ken of features provided, it might seem a little daunting to first timers and redundant to advanced types. It's my goal in this article to highlight the various features of this mighty tool that might just make your day. Let's get to it.
What should you expect from your editor?
Locating your bytes:
Learn Python for Pentesting
The main display is always a hex byte representation of the binary file arranged in a tabular fashion.
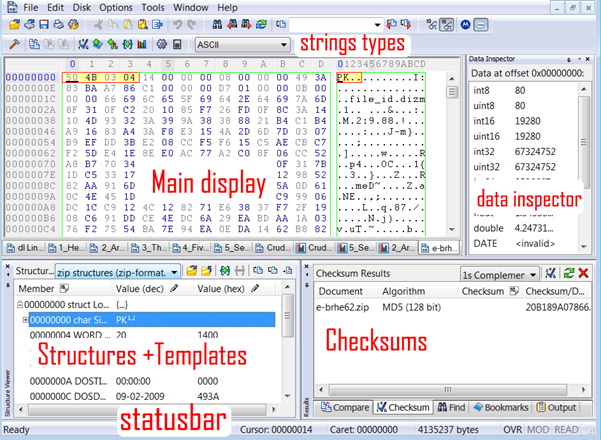
So in such a row and column arrangement, each byte can be addressed in terms of its row offset which is a multiple of the row index and the column count, and the position as per the column added. To illustrate, say the default is 16 columns: each row starting from the first row has a value that adds 10h to the last column in the previous row. In accordance with the same, if you simply multiply the row index, say the 2nd row with the column count, you get the starting offset of your row. That means 2 X 10h = 20h or 32 (decimal). Furthermore, the position of a byte within any row is simply the row offset added to the column position of the byte in that row. So, the 2nd byte in the 2nd row has its position at the 20h + 0h (1st column) + 1h (2nd column) = 21h. The first byte in any row has the offset of the row itself, which is displayed in the row's rank, usually on the left hand side of the display.
The above set of observations can be summarized as,
Bxy = { Rx*0aƩCi } + Cy
Where x and y are the coordinates of the byte B to be addressed as x = row index and y = column offset. Therefore, Rx
is the row index multiplied by the total number of columns added to the column offset Cy of that byte in that row.
Viewing your strings representation:
Further exploring the default displays in most hex editors, the right side is usually populated with a text display of the hex bytes in ASCII/Unicode toggle modes. Various other text formats are provided in dedicated menu items, for instance DOS, EBCDIC or Macintosh strings. The views are synchronized during navigation and selection providing contextual awareness in the viewer.
Editing modes:
The two ubiquitous editing modes are INSERT and OVERWRITE. INSERT mode adds a byte at the selected location and offsets the rest of the bytes by a unary increment, repeated for every byte insert done. These inserts are obviously positioned forward, meaning the bytes preceding the insertion position are not affected by the edit, unless it is a deletion action. For such edits, you need to type or paste a value(s) to position them in the editor environment. File size increases for any addition and decreases for any deletion.
OVERWRITE mode erases the byte prior to the edit and replaces it with the new value without any change in the position of any byte in the file. Thus, in this case the file size remains constant under usual circumstances.
Color coding makes the edits visible to the eye making the process more intuitive.
Status quo:
The information panel usually in the bottom of most commercial editors give the following info: Cursor position, the last selected byte position (caret), the current file size and the editing modes, etc.
Editing and search:
Text search, byte search, byte pattern search, data type template search (signed/unsigned 32-64 bit) in up/down direction and endian type (Little/Big) are some of the better used features. Also:
- Copy/paste and variations of the same.
- Multiple file editing, tabbed views.
Additional features:
Data inspectors give a formatted data types list of the bytes selected giving a quick insight into a particular range of values that might be interesting and how it maps to the list of types to gain clues.
Changing the endianness of the file display is also useful.
Decimal and hex display toggling for the rows and columns are not recommended as working in hex is very intuitive once you get the hang of it.
Hex calculators/expression evaluators/base convertors are usually provided.
Entropy viewer, file compare (diffing), color mapping, structure templates and related visualization data controls are tremendously beneficial for many reversing tasks.
RAM dumping, MBR reading + editing, process enumeration, and process dumping are some of the more dynamic features in forensics-focused hex editors.
Checksums of the selected byte ranges are used a lot for manual signature work. Usually, a list of hashing algorithms is provided for immediate use.
More recently, even hex editors are incorporating some sort of disassembly tool, so this immediately leverages the static analysis activities within the editor environment.
Plugins provide extensibility.
What are the above used for?
Let us start with a simple file rebuilding activity from Binary Auditor's package.
A PE file is split into 5 parts which have to be recombined to a working executable.
This exercise is _001 from the File Understanding folder.
Instructions are:
"Guess what that means and what you have to do. That's right, put it all together and make a working PE file. It shouldn't be too hard for seasoned reversers and will be a good learning experience for the rest of us.
Things you'll need to do:
- Add/Create the Dos Stub/PE Header.
- Figure out which section is which.
- Put it all together and make it run.
Have fun :)"
The 5 sections are named: 1_Here.hex, 2_Are.hex, 3_The.hex, 4_Five.hex and 5_Sections.hex.

[caption id="attachment_12813" align="alignleft" width="901"] Click to Enlarge[/caption]
[caption id="attachment_12820" align="alignleft" width="902"] Click to Enlarge[/caption]
[caption id="attachment_12822" align="alignleft" width="904"] Click to Enlarge[/caption]
[caption id="attachment_12824" align="alignleft" width="900"] Click to Enlarge[/caption]
So let us fit a header first. The PE header is very well described having an MZ header, the DOS stub, the PE header, the Optional header, followed by the sections table and the individual sections themselves. The sections contain code, data, resources, imports and exports among others. I built the sections table as follows:
So how do I know which raw dump is what section?
Let's take a look at the raw dumps themselves and see if we can point out which ones are which. Let's search for the .code section among them as this section will contain the entry point and should be an excellent starting point for adding the rest of the sections thereafter. Remember, opcodes in the x86 instruction set are very specific in having additional bytes for the MOD/RM and SIB parameters. Do not go for any textual representation though, as most of them don't fall in the ASCII realm, and you won't get any figurative deduction.
So just by looking at your dump, you should be able to point out the ones that stick out like a sore thumb or more precisely, the kind of opcodes that are used the most and are statistically having a higher probability of occurring in any x86 executable file. Even though the Intel instruction set is huge (CISC), the most used instructions amount to just 13-16 most essential ones. This bit has been independently researched and verified.
Let's logically think for a moment: a Windows binary has to make certain OS calls using the import table so that it can leverage the functionalities provided by the OS. The opcode E8h immediately comes to mind. This would be the call instruction taking a memory address as an operand in most cases (byte displacements also work). Every program would have to have some control flow logic branching conditional statements of if…then...else; these are implemented as jnz, je and others from the jcc family. Typically look for 74h, 75h followed by a DWORD address. Xor is 33h, push EBP is 55 and so on. The last one is the most probable function prologue starting statement/opcode in x86 platforms for any function calls involving the stack. When you already have a few candidates, just skim through the dumps and see which ones have the highest occurrence of x86 opcode bytes.
You might reminisce about a similar approach in classic cryptography. It's very simple to automate and you could build a visualization application of sorts or a script to identify the resulting count-based histogram in any dump set and find out the most probable ones. You will find that the last dump is in fact the code section (5_Sections.hex). Well, my favourite hex editor already facilitates character distribution analysis. Let's see if we can detect the code section just using this really fast method. :-)
I set the current view to this dump and go to Tools>Character Distribution and sort by percent. Voila!
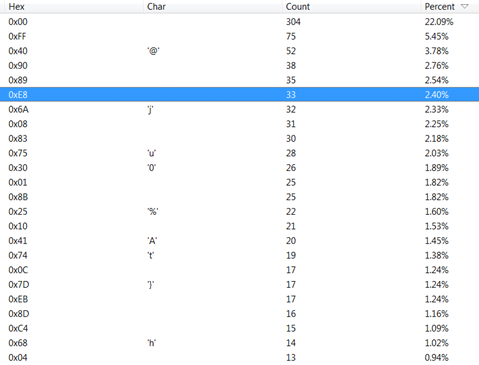
Study the top list of hex characters/opcodes –
Null bytes take the larger share as expected, followed by FFh. Exclude them.
NOP or 90h is 2nd in the re-ranked list.
Call or E8 is 4th in the list.
Familiar ones visible are 75h (Count 28), 74h (Count 19) and EBh or jmp at count 17 in the dump.
You get the idea. This is the confirmed code section indeed.
Running the same distribution algorithm on other dumps give results different from the code section. Try it.
Another useful utility to locate the call regions is really intuitive in graphics.

This makes my job of locating call opcodes fast in the code and gives an indication of the distribution of call opcodes in the code, the possibility of call clusters prior to decompression etc. Here, it's quite simple that in live unpacking and memory dumps, such tools are invaluable for analysis.
So, you plug the first section in your hex editor after making sure that the section starts at a proper alignment. 400h seems just fine in accordance with the file alignment optional header value to be set by you when you make the final touches. This is also the default code section offset for Windows compilers. Most alignment values are multiples of 200h. Memory alignment is usually multiples of 1000h, owing to page boundaries. This is simply set in the optional header and the section headers, and is not to be worried about anymore. So you need to fill in a few more bytes to make the section size a multiple of the file alignment value set. You could experiment with other values as well. This per section alignment has to be done for every one of them if required, or else the PE file will not execute properly as the Windows loader will notice the discrepancy.
On studying the compiler output of simple Windows GUI applications made in C/C++, you will notice that the data section contains the strings that are used inside the code, especially those that are passed to the MessageBoxA/W dialog box function calls. Looking for sets of printable strings in the dumps, you will find that the 3rd dump has quite a few readable strings. This should be your .data section. Make a minimum 200h 0 byte extension to the current PE hex view to give a data section template, and paste the entire dump on it. You will see that this action is not yet accurate and if you run the file later without cross referencing the strings' addresses from the compiled code region, it won't work. But save that for later, as that can be figured out in a debugger/disassembler, and then fine tuning has to be done.
Moving onto our 3rd section: the .reloc. I just picked this name as other compiled files had a similar relocation section which gives a possible set of mapping addresses if the default address is not available from the loader. In this file however, it's quite redundant, and I could swap the section contents of .data with this just to make the PE work with the string references. At this point, I find that the addresses for our .data section are not used and the 3rd section addresses from C00h in file, are referenced from the code. So if you remember, the text in the section header for names is not really relevant for the PE loading; it's just for our reference. So, the section named .reloc contains the strings section and.data ostensibly contains the .reloc contents. This was in transit and I don't plan to rectify this convenience factor as the PE loads perfectly after these details are (not?) taken care of.
Very clearly, the imports section is the 2nd dump, containing the usual API strings in the IAT format. Here, while building the section for imports, be careful of what the virtual section starting address is, as even if you fix each thunk, the tedium and error-prone approach is just not worth it. Just reference the disassembly code in a debugger and calculate the import table's starting address. Map a section in file to that virtual address and we end up with the IAT in section number 4. This step is a little tricky if it's your first time, but I have no doubt you will get the idea.
Then, a function call is made from the imports and a thunk address is referenced in the file which gets filled by the actual addresses of the DLL function names by the loader. The IID structures or the Image_Import_Descriptors have a set structure; the Original First Thunk and the first thunk are the structures to be kept an eye on. The name type references the name string's hint offset in the table, which is a 00 byte prefixing the function name string. It's an elementary import table info, but it's very useful in rebuilding files, even from memory and malware unpacked.
A little tip to get it even faster on the imports: look at the thunk addresses. Or rather, the virtual addresses minus the base address. The whole hex number usually ending in zeroes is the virtual address minus the base address or the requisite virtual address info to be filled in the section header for the imports. This is the next lowest hex address that fits into the 1000h VA alignment scheme (also check the optional header for different values). So if the last section had VA 3000h and the imports thunk address 4200h, then 4000h should be the VA for this import table with the current set of IID values. To illustrate, an excerpt from the import dump;
[plain]9C4100000000000000000000A8410000BC410000C8410000D8410000EC4100000042000018420000284200003C42000000000000000000004C4200005C420000644200007042000078420000844200000000000000000000684100007C410000[/plain]
Notice the periodic occurrence of 4. All the thunk addresses here start with 4XXX for every word. In the above instance, it's 41XX. Rest assured that the VA of the IAT is 4000, the next lowest multiple to 1000h, post the previous section. Well you did not even require the debugger for that eh? In fact, you should use your debugger post hex analysis, and only for verification, not for deduction and inference for this example. Try it! By the way, memory IAT rebuilding takes a lot more into account than such simple tricks, but for this example, it's allowed to be naïve. :-)
At this point the requisite .resource section is quite easily identifiable by the tell-tale shape observed in the hex editor with large spacing and readable strings resembling spaced out Unicode. Most resources compiled in PE look like that (4_Five.hex). The strings are the names of the main application's Windows title and dialog box strings and the About Window strings as well. The resource tree in PE is a little involved, with specific indexes for each type of data in the resource tree. Here, it's already built without the need to decompile the resource tree, so we just place it in the last section and fix any pending cross references from the code in the debugger.
The rest of the file is filled till the last section has a perfect alignment. The MZ headers are just copy pasted from any legitimate PE file header. The PE headers are copy-pasted to correct the template and then the offending values are overwritten, keeping the more redundant ones in place without the need to write byte to byte and build the header like that. The OEP is again deduced by the flow of code (really simple for this application...look for GetCommandLineA() and the first function call prologue opcode 55h) observed in Olly and the OEP is set accordingly in the header.
Let's see if your work has been successful.
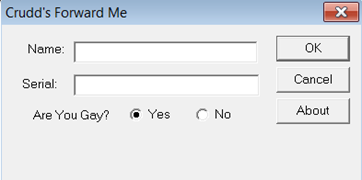
Yes! It works eh?

Unsavoury humour...
And...
Judgemental as well...
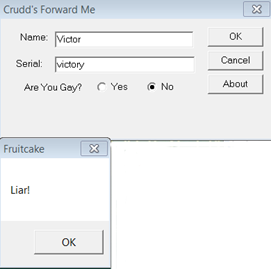
Finally, what I needed. :-)

As much as you may be pondering on the use of other tools, this one task could not have been better done in any other tool. This exercise demonstrates two things:
- The tools are there only to facilitate your job, not do it for you.
- The simplest of tools can save the day.
Note: Solutions for the Binary Auditor package are not provided, so you have to solve them manually. I hope this encourages all readers to go and try your hand at this exemplary reversing course without dumps and cheat sheet eh?
Learn Web Server Protection
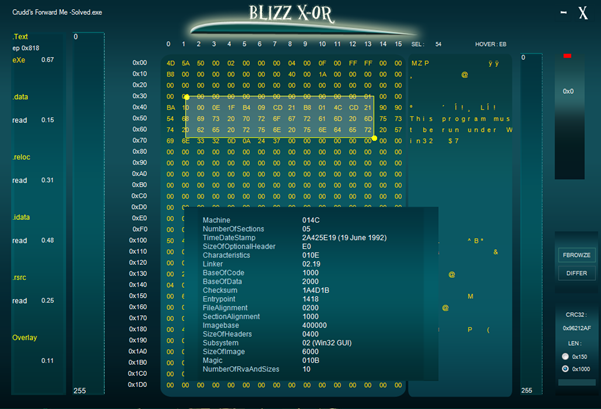
In keeping with my previous article that highlights different aspects or ergonomic design, I have taken a shot at designing my own hex editor for my binary analysis duties (focused on analysis not extensive editing) and have come up with a one screen design that accentuates the essential info required during manual analysis and makes navigation and signature hash value recording a breeze to work with. I call it the Blizz X-or and you could try it at www.victormarak.in in the code page. The screenshot above describes the motivation for the same. It features easy navigation, and file parsing, an intuitive file explorer, a file compare util and very easy hash extraction process. What are your adventures in hex-land?


