Memory forensics and analysis using volatility
Volatility is one of the best open source software programs for analyzing RAM in 32 bit/64 bit systems. It supports analysis for Linux, Windows, Mac, and Android systems. It is based on Python and can be run on Windows, Linux, and Mac systems. It can analyze raw dumps, crash dumps, VMware dumps (.vmem), virtual box dumps, and many others.
Learn Network Forensics
Installation
The Volatility software may be downloaded from here-
https://code.google.com/p/volatility/downloads/list
It also comes pre-installed with Backtrack 5 R3, which I am presently using.
Demo tutorial
Selecting a profile
For performing analysis using Volatility we need to first set a profile to tell Volatility what operating system the dump came from, such as Windows XP, Vista, Linux flavors, etc.
We have a memory dump with us and we do not know what operating system it belongs to, so we use the imageinfo plug-in to find this out.
I have also explained how to take a memory dump using Helix ISO in the end of the document for the people who might be new to it.
Type ./vol.py imageino –f <Destination of the memory Dump>
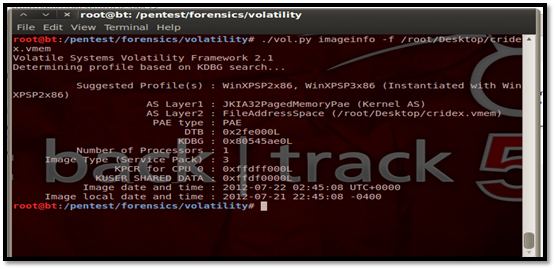
From the above screenshot, we can see that Volatility suggests using the profile for Windows XP SP2 x86 or Windows XP SP3 x86. Let us select Windows SP2 x86. The default profile for Volatility is WinXPSP2x86 if we do not specifically set a profile.
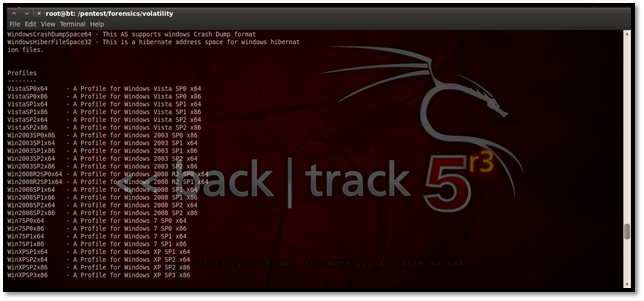
Here is the list of the available profiles in Volatility. We can see all Windows profiles here; the Linux profiles will be included in future updates. So, if we are using Linux, we will need to create our own profile.
Viewing running processes
This plug-in gives us the option to view all running process on the particular system during which the memory dump was taken. Let us see how to use it:
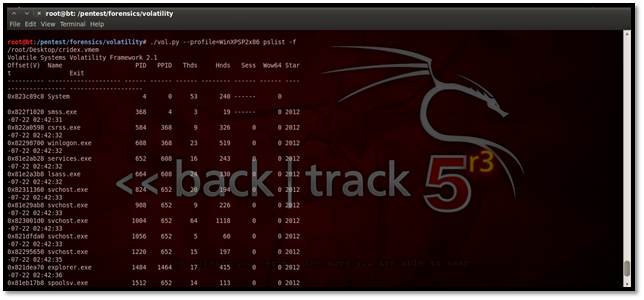
The above screenshot shows a clear view of all the processes running during the memory dump.
Using Kdbgscan
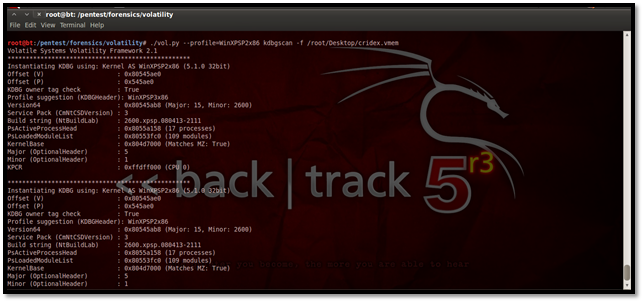
This particular plug-in is designed to positively identify the correct profile of the system and the correct KDBG (kernel debugger block) address. It simply scans for KDBG header signatures linked to the profiles in Volatility. This is mainly helpful in clearing up confusions which might be caused if the Pslist plug-in not showing any processes in the process list. This may happen if a KDBG with an invalid PsActiveProcessHead pointer is found earlier in a sample.
Using Kpcrscan
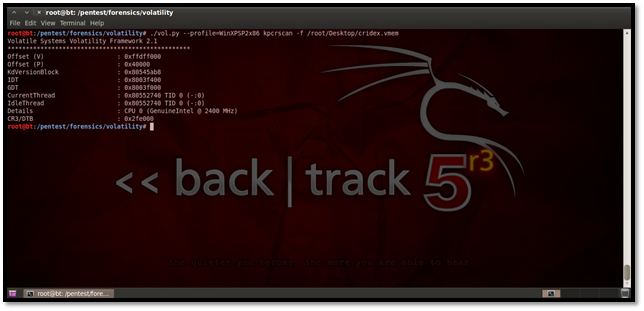
This plug-in is used to scan for KPCR (Kernel Processor Control Region) structures. A KPCR is a data structure used by the kernel to store the processor-specific data. Kpcrscan searches for and dumps potential KPCR values. Each processor on a multi-core system has its own KPCR. In the screenshot below we can see the details of the processor, which is a single-core processor.
Using Psscan for malware analysis
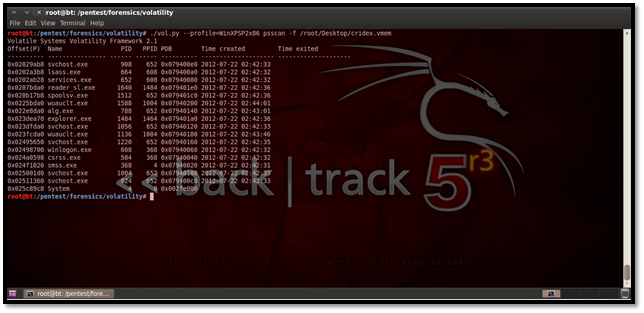
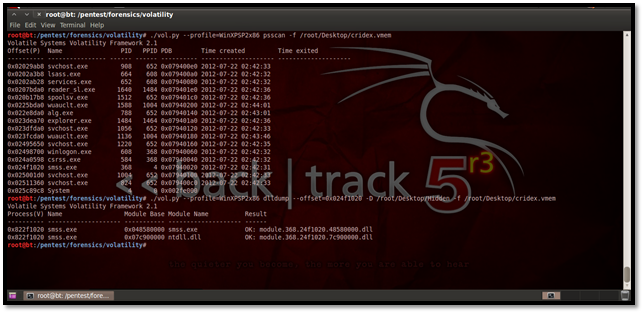
This plug-in is mostly used for malware analysis and scanning rootkit activities. It scans for inactive, hidden and unlinked processes by a rootkit/malware. Here's how we do it:
Using Dlllist
To display the DLLs for all currently running processes or a particular process we use this plug-in.
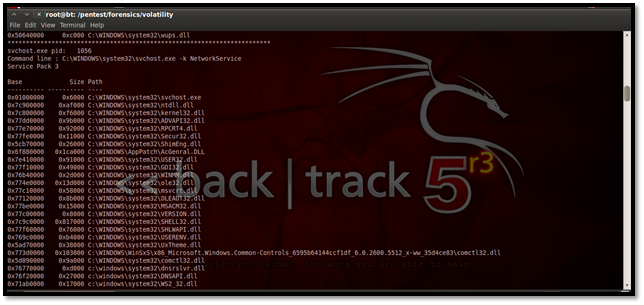
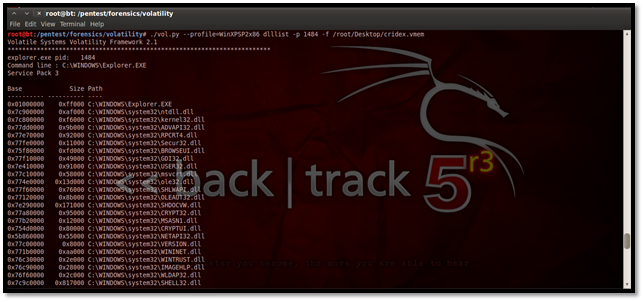
For listing the DLLs for a specific process, suppose we list here the DLLs of explorer.exe, which has the process id 1484. The process id may be found using the pslist plug-in.
Using Dlldump
We can dump all the DLLs for further forensic analysis using the command:
./vol.py --profile=WinXPSP2x86 dlldump -D <Destination Directory> -f <memory image location>
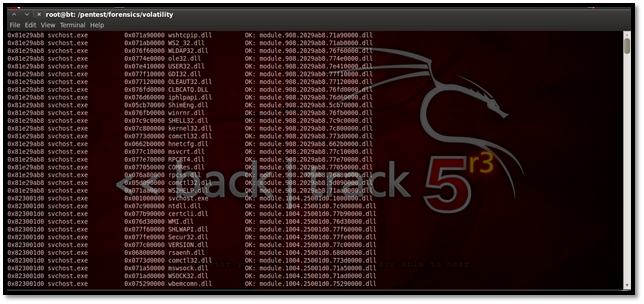
We can see the dump of the DLLs in the directory below:
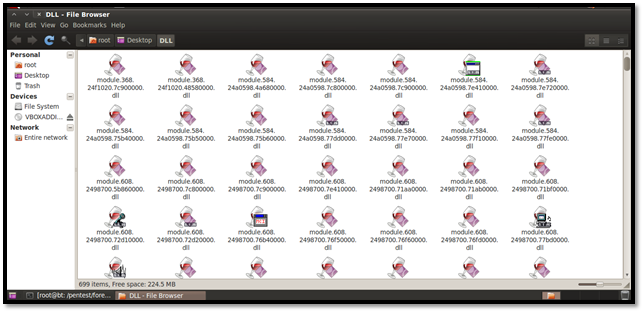
We can even dump DLLs from specific processes if we figure out that a malicious process may have been running. Similarly, we can dump DLLs of a hidden process by using its offset address as shown below.
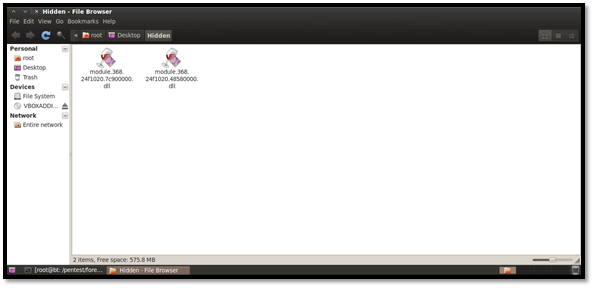
Here is a list of all hidden processes once again. Now we have used the offset address for smss.exe, which is 0x024f1020 and dumped the DLLs in the folder named Hidden.
Here are the DLLs from the hidden process smss.exe:
Using Pstree
This plug-in may be used for viewing the processes in a tree form. Similar to Pslist, it does not show the hidden processes. Here is how it looks:
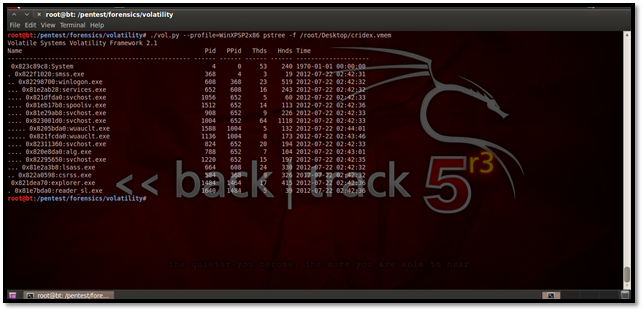
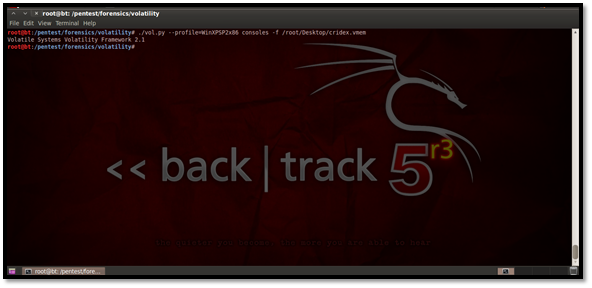
Using consoles to find commands used in cmd.exe
This plug-in is used to find the various commands typed in locally or remotely via backdoors. Since our capture did not have any typed in commands in cmd.exe, we get no results here:
Using verinfo for displaying version information
This plug-in helps to display the version information for portable executable files.
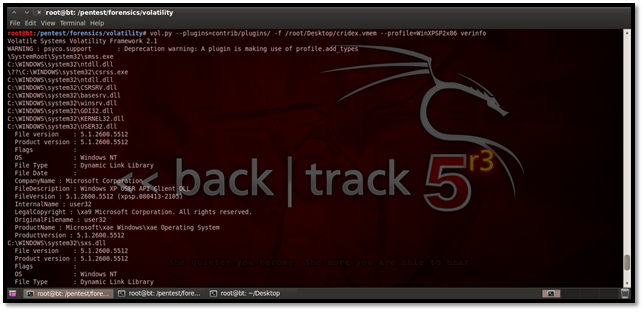
From the above screenshot we can see the file version, product version, OS, file type, etc.
Using connections plug-in to display TCP connections
This plug-in is used to display TCP connections that were active at the time the memory dump was taken. You can see this in the below screenshot:
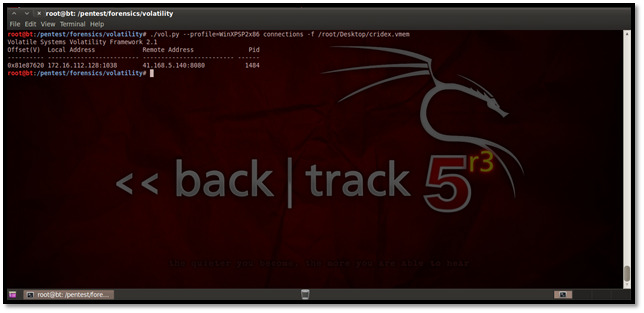
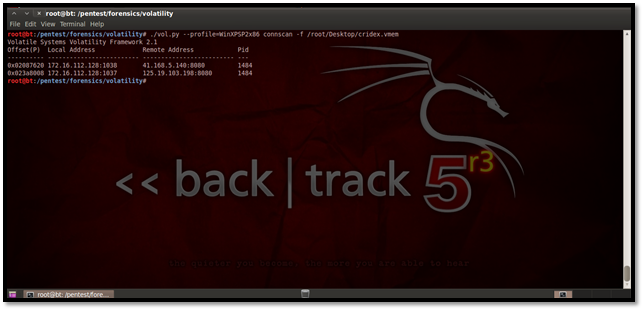
Using connscan
The connscan plug-in helps us to find active connections as well as connections that might have been terminated. Here is how to use it:
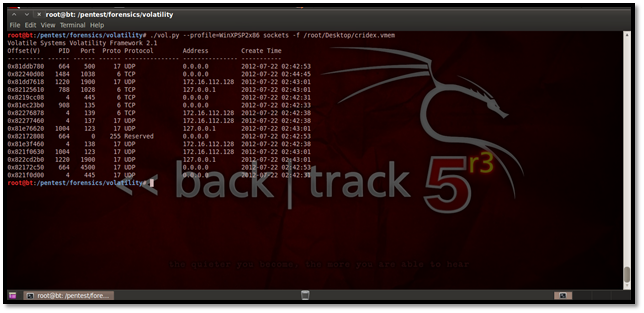
Using sockets
This plug-in helps us to find out the listening socket connections during the time our memory dump was taken. These include TCP as well as UDP connections.
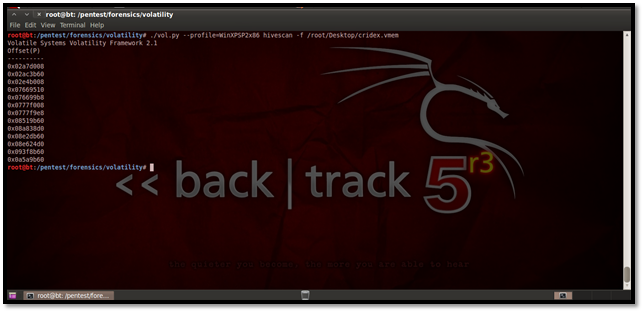
Using hivescan
This plug-in helps us to find physical addresses of registry hives in memory.
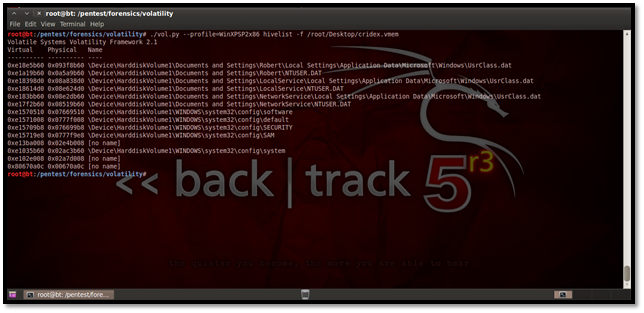
Using hivelist
This plug-in helps us to find the virtual addresses of registry hives in memory.
Using Svcscan
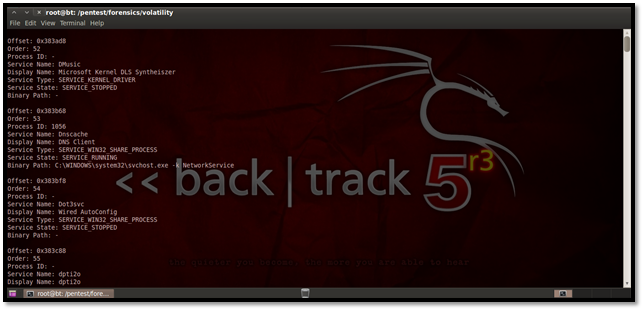
This plug-in helps us to find the list of services running on the system.
Memory imaging using helix
We are using the Helix ISO to do a live capture of the RAM for our system. We start Helix and go to Live Acquisition:
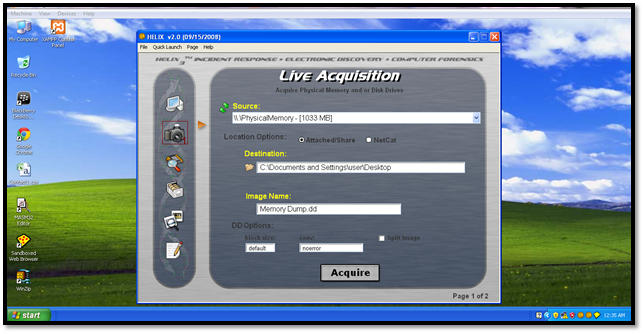
Simply set the destination and the image name and press Acquire. This gives us the memory dump of our physical memory.

Get your free course catalog
So this shows how we can use Volatility for forensic analysis of a captured physical memory image.
Sources


