Traffic analysis for incident response (IR): How to use Wireshark for traffic analysis
Traffic analysis is the process of monitoring network protocols and the data that streams through them within a network. In this article, we’ll discuss how you can use Wireshark for network traffic analysis. We’ll also discuss how you can use various filtering methods to capture specific data packets and how different graphs visualize the traffic streams.
Please note that we shall be jumping straight into the use of Wireshark and will assume your ability to install and run the tool.
Learn Python for Pentesting
Importance of network traffic analysis
There are many things that can go wrong within a network. In order for us to understand what we are dealing with and to troubleshoot the problem, we make use of packet analyzers such as Wireshark in order to perform network analysis. Using Wireshark, we’re able to:
- Analyze problems within the network by assessing the packets as traffic runs through the network
- Detect malicious traffic from malware or network intrusions from unauthorized or malicious individuals/parties
- Determine which machines and resources to isolate from the network due to the traffic coming from them
- Determine network statistics by filtering network packets based on your requirements
- Determine systems within the network that are heavy on bandwidth consumption
How to use Wireshark for packet analysis and filtering
Wireshark allows us to capture raw data which is then presented in a human-readable format, making it possible for you to understand the flow of traffic within the network.
Before we can begin capturing packets for analysis, we need to take into account the types of devices available on the network and the traffic they emit. We should first understand the type of traffic we are interested in collecting before we begin packet sniffing. We’ll first need to answer the following questions:
- Does your network card support promiscuous mode?
- Promiscuous mode allows your machine to collect data packets that are not intended for your machine
- What devices are within the network?
- Different devices on the network respond differently and transmit different data packets
- What traffic do you want to capture?
- The traffic you are interested in capturing is entirely dependent on the devices within the network
We need to know how to use the filters that come with Wireshark in order to ensure we are capturing the right packets for analysis.
How to use capture filters
We can use capture filters before the initiation of the packet capture process. They work by filtering out traffic that does not meet the criteria specified within the filter.
The Berkley Packet Filter (BPF) syntax is used when creating capture filters. It is important to familiarize ourselves with this syntax, as it is the most commonly used by packet analyzers. The BPF syntax uses a combination of two arguments, identifiers and qualifiers, which are explained below:
- Identifiers: These are values which you would be looking for within your packets. For instance, filtering a packet for an IP address, you will end up with a filter that is similar to host 192.168.1.1. In this case the value 192.168.1.1 is an identifier
- Qualifiers: There are three types of qualifiers:
- Type: Type qualifiers refer to the name or number that your identifier refers to. They include host, port and net. In the example above — host 192.168.1.1, host is the type qualifier
- Direction: We can specify direction qualifiers when identifying packets from a particular destination or source. For instance, src host 192.168.1.1 allows us to capture packets from a specific host. On the other hand, dst host 192.168.1.1 allows us to capture packets destined to the host 192.168.1.1
- Proto: This qualifier allows us to specify the protocol that we are interested in capturing. For us to capture http traffic from host 192.168.1.1, we would use the expression src host 192.168.1.1 and tcp port 80
We can also use a combination of operators to refine and complicate our filters. For instance, we can use the concatenation operator (&/and), alteration operator (|/or) and negation operator (!/not). The following table shows some of the capture filters that you can use within your network:
Capture filters with protocol header values
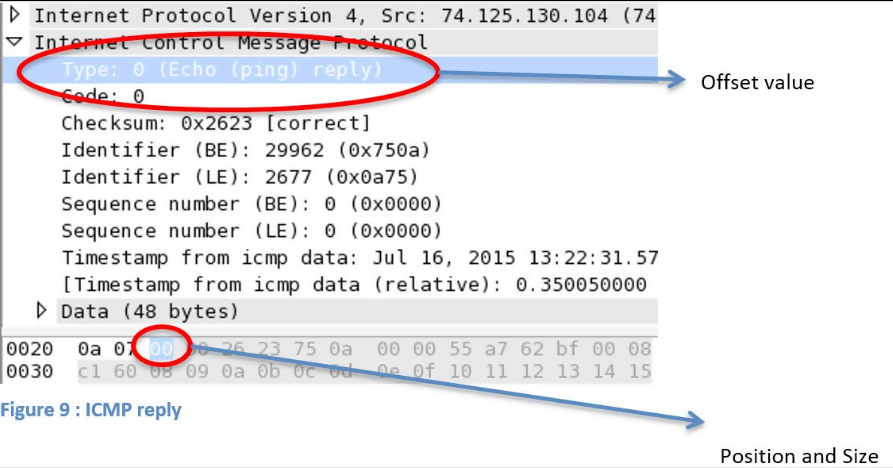
We can create capture filters by making use of offset values within protocol header fields. The syntax used is proto[offset:size(optional)]=value, where proto is the desired protocol to filter, offset is the position of the value in the header, size is the length of the data you are looking for and value is the data you want to find. The figure below shows the structure of an ICMP packet.
From the figure, we are able to tell that the offset counting begins at 0 and the size of the field is 1 byte. We can therefore build a capture filter by using the filter icmp[0:1]=0.
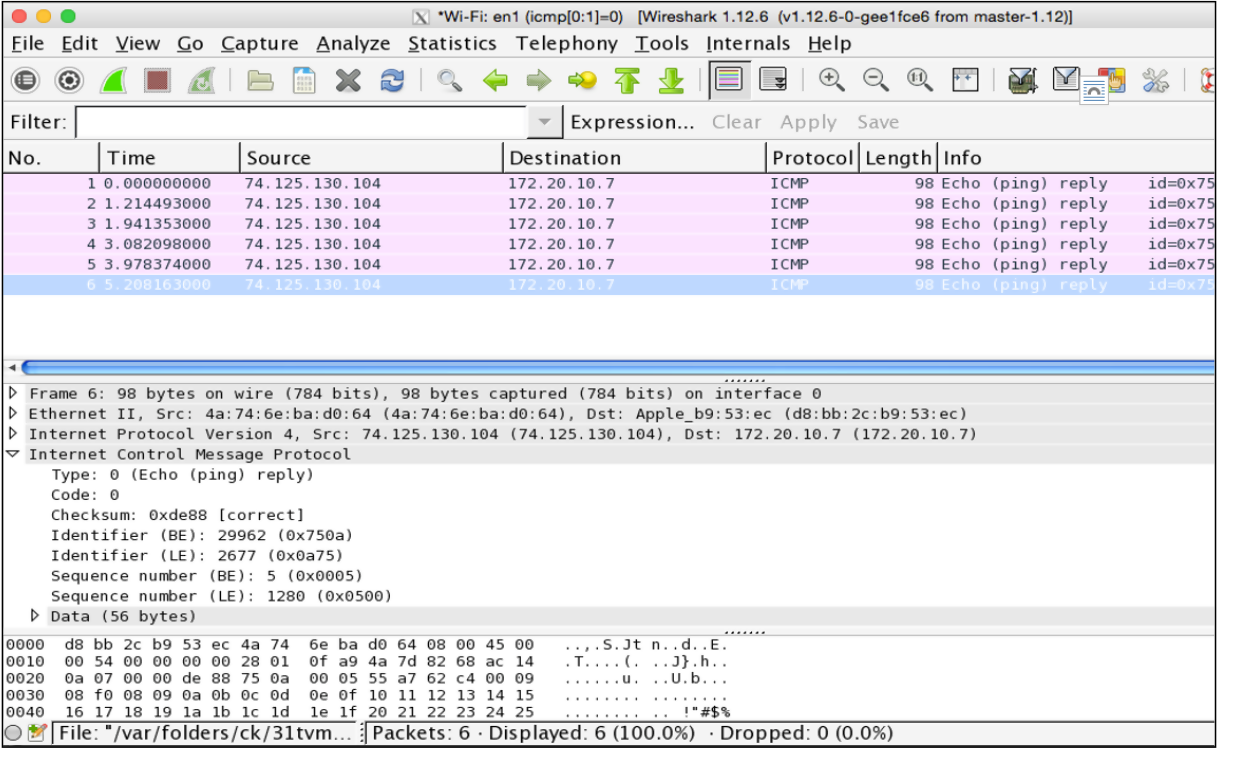
We use this filter and ping google.com, and Wireshark captures the following reply packets in the image below:
We can use similar filters to filter traffic on the basis of the header values of different protocols. The table below shows some few examples:
How to use display filters
Unlike capture filters, display filters do not discard packets; instead, they hide them from view. This is more effective since discarded packets cannot be recovered.
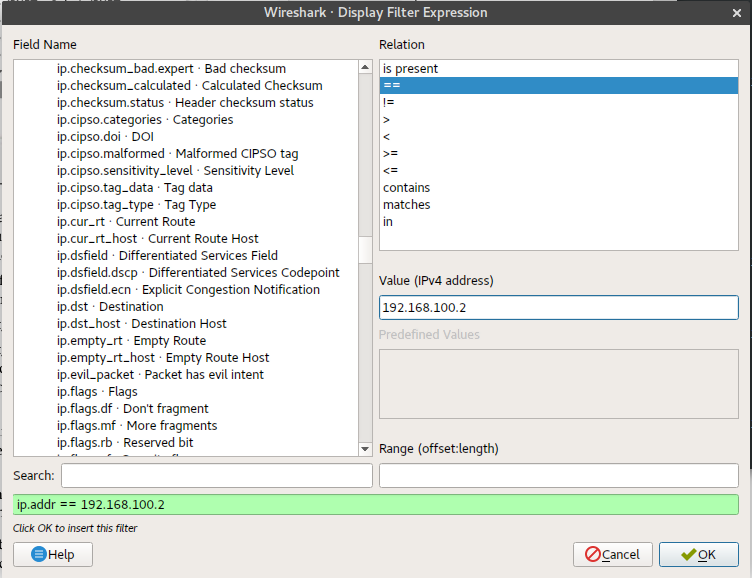
Display filters can be created from IP addresses, ports, port numbers and header values of certain protocols. Further filtering can be done using expressions and operators in order to determine specific packets that we need. The “Expression” button beside the search box gives you a “Display Filter Expression” dialog box that allows you to combine different display filters and relations. This can be seen below:
In the image above, we used the field name ip.addr, used the expression == and issued the value 192.168.100.2, which was our IP address. The range box at the bottom allows us to define a range that can refine the filter more. Some protocols may allow this. Ranges may vary, for instance, examples may include 0-5, 1-78 and even 120-255. There are comparison operators and logical operators which are also important in refining searches.
The display filter allows you to refine searches by using three configurable options:
- Display filter: Here, captured packets can be displayed based on certain criteria. For instance, the ip.addr == 192.168.1.1 (which is based on an IP address)
- Hex value: Here, you can issue a Hex value that can be used to find a specific packet. The format is - 0A:C4:22:90:45:00
- The string: Here, you can issue a string that contains the name of the server (hostname) or even a vendor (for instance DELL, Cisco, Google and so on)
- String options: Here, you can specify certain criteria for the string being searched. For instance, case sensitivity can be defined here. The following screenshot shows the search string “google” specified
Analyzing endpoints
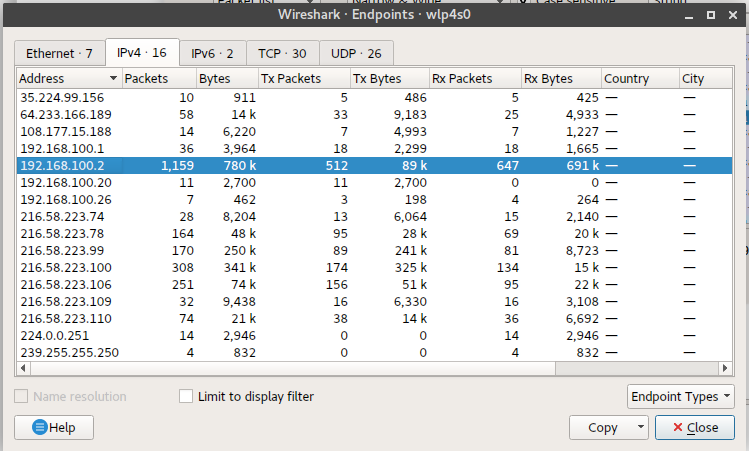
Endpoints are devices that communicate between each other. This is true in the context of Wireshark. For you to analyze communication between endpoints, select one TCP packet, then from the “Statistics” menu, select “Endpoints.” You will be presented with something that looks like the screenshot below:
Depending on the packet you select, some tabs may appear disabled and others enabled. Those that appear enabled will be so, since the related protocol will be active. In the screenshot above, we can see that the most traffic-intensive endpoint is 192.168.100.2. We can also note that the IPv4 tab contains 16 endpoints and the Ethernet tab contains 7 endpoints.
Analyzing endpoints in this manner will allow us to understand how much traffic each endpoint within the network is transmitting.
Analyzing graphs for traffic
When dealing with huge amounts of traffic, it is best to work with graphs instead of scrolling down thousands of captured packets to identify errant packets. There are a couple of graphs that can be used within Wireshark.
IO graphs
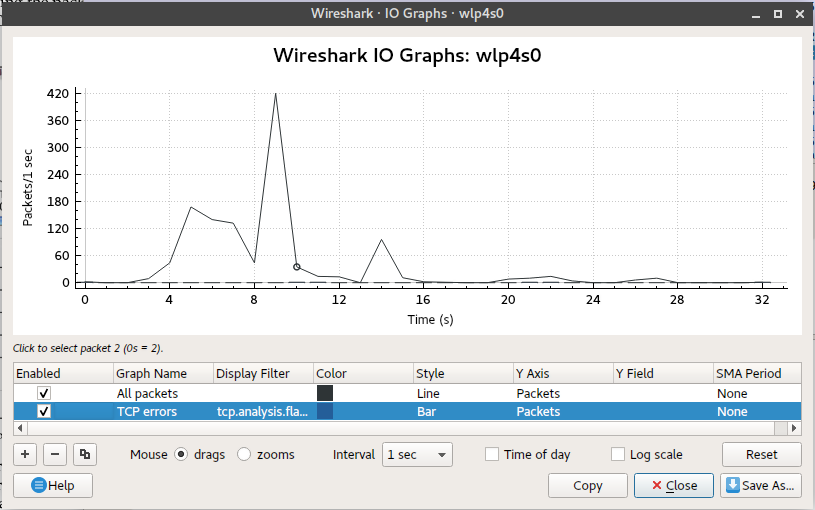
These graphs can be used to determine traffic highs and lows. This is very important when it comes to monitoring. In order to make use of an IO graph, select a packet and click on “IO Graph” under “Statistics.” To create an IO graph, select “Statistics” then “IO Graph.”
We were able to generate the graph below.
According to the graph above, the data in the x-axis represents the time in seconds and the data in the y-axis represents the packets per tick. You can filter the graph to display graphs based on the time of day, interval and log scale, and you can even reset applied settings back to the default.
Flow graphs
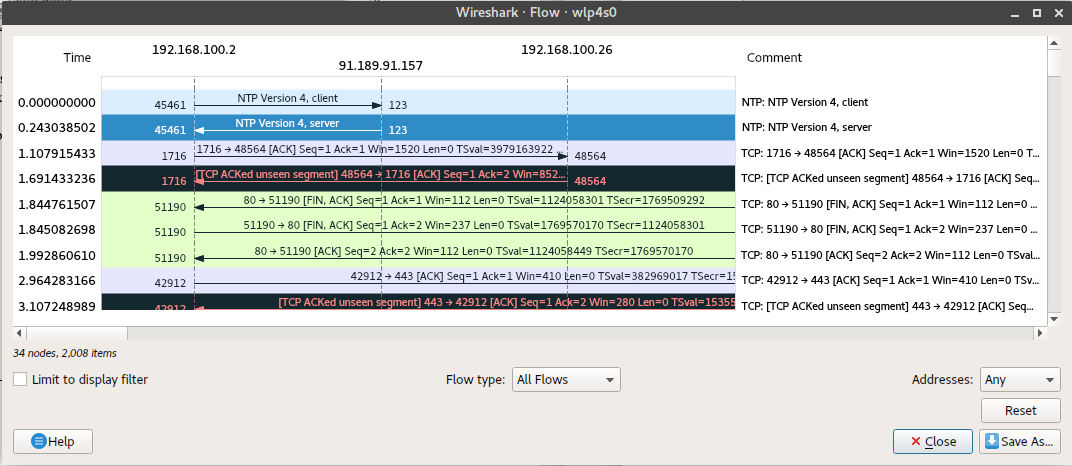
These provide us with a column-type graph, which shows which we can use to troubleshoot dropped connections, lost frames, re-transmission traffic and much more. We can be able to export these results into a text-based output. To create a flow graph, select “Statistics” then “Flow Graph.” Doing this, we were able to generate the graph below.
TCP stream graphs
These are a series of graphs that depict network traffic in a graphical form differently from the graphs above. We shall look at a couple:
- Round-trip time graphs
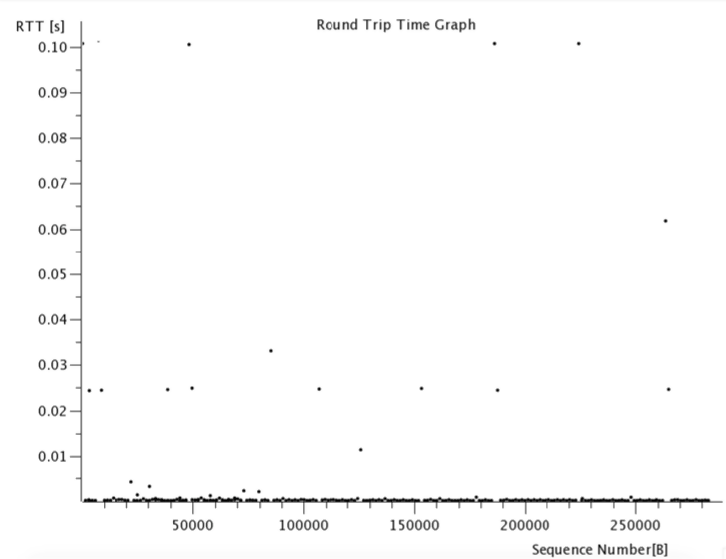
Round-trip time is the duration that the ACK for a sent packet is received. This happens within TCP communication, where for every packet sent, there is an ACK received, confirming the delivery of a packet. In order to create a round trip time graph, select a packet, then navigate to “Statistics,” then select “TCP Stream Graph” then “Round Trip Time Graph.”
There are a few things to note:
- The x-axis represents the TCP sequence number, while the y-axis represents the RTT in seconds
- The points on the graph represent the RTT of a packet. An empty graph could mean that you selected an opposite direction packet
The screenshot below shows an RTT graph representing some web traffic. You can notice some latency at some points.
In order to identify latency, you can check for a vertical line of plotted RTT points. This could either suggest a queued-up packet from the sending device or duplicate ACKs being suffered.
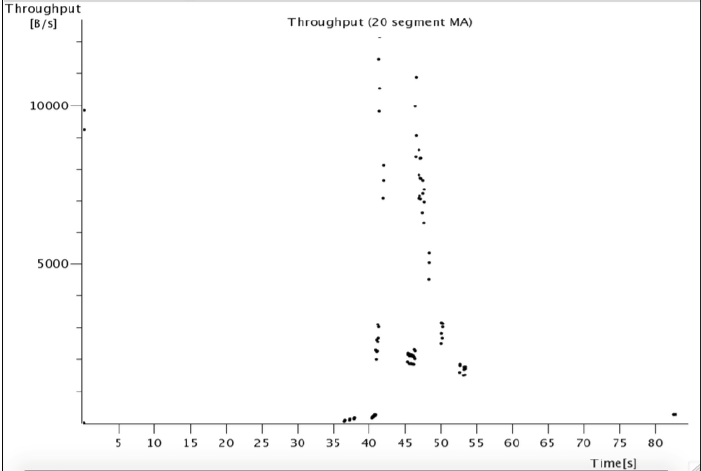
Similar to IO graphs, throughput graphs depict traffic direction. However, these graphs differ from IO graphs in that they portray unidirectional traffic, whereas IO graphs portray traffic in both directions. Note that the data you will see on the graph will be different depending on the selected packet. The following screenshot shows a throughput graph:
In the graph, the x-axis represents the time in seconds and the y-axis represents the throughput in bytes per seconds.
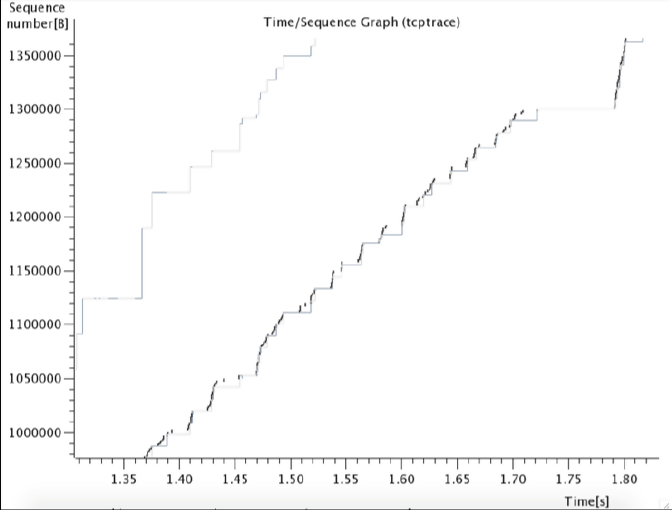
This graph is used to depict the flow of TCP traffic with time. Just like throughput graphs, the traffic is unidirectional. Using this graph, we can be able to tell information about segments that are currently travelling, acknowledgement of segments we have received and the buffer area which the client is able to hold. To create this graph, follow the steps below:
- Open your capture or trace file
- Select any TCP packet (different ones will give different results)
- Select the “Statistics” menu, then select “TCP Stream Graphs,” then finally select “Time sequence graph (tcptrace)”
After following the steps above, you will be presented with a graph that looks similar to the following:
In the graph above, the y-axis represents the TCP sequence number and the x-axis represents the time in seconds. The TCP sequence numbers are incremented by the bytes sent with each packet. That is to mean that if the sequence number is 1 and the packet being sent has 10 bytes of data, the sequence number will be incremented by 10, making the next sequence number 11.
Conclusion
In this article, we have seen how you can be able to work with endpoints to analyze traffic and visually represent this, depending on the data you are working with. We have seen the different types of graphs that can be used to analyze traffic and their application areas. We have also discussed the different filtering methods and seen examples of how you can be able to filter traffic as it is being captured or displayed.
This article does by no means exhaust the methods Wireshark can be used to fully analyze traffic but creates a good picture of Wireshark’s capabilities. Keep an eye on this site, as we will soon be publishing tutorials on more specific applications of Wireshark within an IR framework.
Learn ICS/SCADA Security Fundamentals
Sources
- How to Use Wireshark to Capture, Filter and Inspect Packets, How-To Geek
- How to Filter by IP in Wireshark, NetworkProGuide
- 6.4. Building Display Filter Expressions, wireshark.org

