Network traffic analysis for IR: Statistical analysis
Introduction to statistical analysis
Statistical analysis is one of the three main categories of analysis that can be performed on network traffic data. It provides a much more detailed analysis than simple connection analysis and takes a different approach to identifying potential indicators of compromise than event-based analysis.
Statistical analysis is typically geared toward performing anomaly detection. Based on the wealth of information available to the analysis algorithm, it can make educated guesses about what should be considered “normal” versus what is “abnormal” or “anomalous.” Any deviations from the norm may be an indicator that something is going on, making statistical analysis ideally suited to helping an incident responder determine where their investigative efforts can be focused to maximize their probability of success.
Learn Incident Response
Performing statistical analysis
In order to successfully and rapidly respond to a potential incident, cyberanalysts first need to know where to look for potential indicators of attack. Data science is extremely good at identifying patterns and correlations from large amounts of data.
Statistical analysis uses the tools and techniques of data science. Data science is a very large field, and most incident responders don’t have the background to be a data scientist.
However, even simple statistical analysis techniques can be extremely useful for incident response. Techniques like clustering and stack analysis can be easily performed by anyone and can be extremely helpful in drawing attention to data that may warrant further investigation.
Clustering
Clustering is an application of unsupervised machine learning where the developer does not provide any input to the algorithm to point it toward a certain solution. Instead, the developer provides the desired number of clusters that they believe should exist in the dataset and the algorithm generates what it thinks is the best allocation of data points to clusters.
Several different clustering algorithms exist, but one of the most common ones is K-means. K-means works by randomly assigning initial cluster centers and then updating them by reassigning data points to the cluster that they best fit into, recalculating the cluster centers as the center of the points assigned to them, and repeating the process for a set number of iterations or until the clusters stabilize.
Clustering is useful for incident response since it can help an analyst discover unknown relationships within a dataset. The initial random state of the cluster centers means that different runs of the algorithm can produce different results. Performing multiple runs of the algorithm (potentially with different numbers of clusters) may draw attention to data points that are anomalous and worth further investigation.
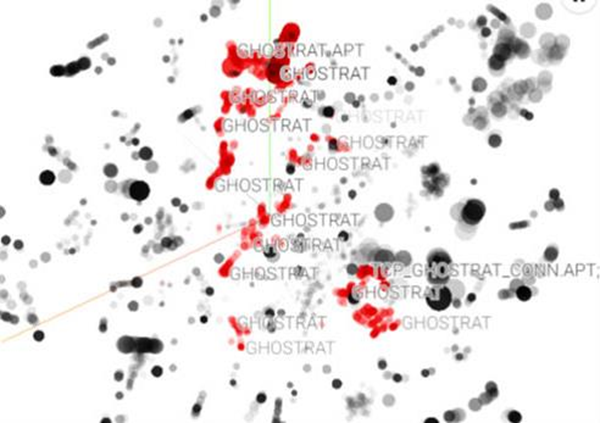
An example of useful intelligence generated by traffic clustering is the image above created by TrendMicro. The researchers who generated this image took advantage of the similarity of traffic from Gh0stRAT variants to build a clustering tool that could detect them based on their C2 traffic. As shown, many of the Gh0stRAT variants’ traffic formed large clusters, making it easier to identify and investigate potential infections.
However, false positives also exist inside the clusters of Gh0stRAT variants and false negatives are located outside of them. Clustering is useful for identifying data that may require more investigation, but it can’t be trusted to correctly classify something as a threat or not to miss something.
Stack counting
Stack counting is a simple means of performing anomaly detection on one feature of a dataset. In stack counting, an analyst puts data points into bins based on their value for a certain feature. These bins are then sorted based on the number of data points that they contain.
Under most circumstances, benign events are common and malicious events are uncommon. Therefore, for a given feature, anything that falls into a bin with a low number of data points inside it may be worth further investigation.
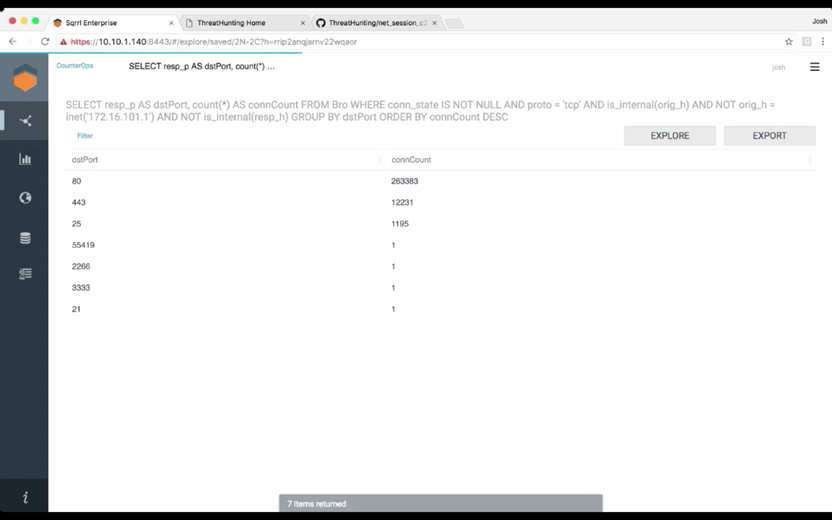
The image above, generated by Sqrrl, shows the result of stack counting a collection of web traffic going to a web server, based on its destination port. As shown, the vast majority of traffic has a destination port of 80, 443 or 25 (HTTP, HTTPS and SMTP). However, four different ports each have one hit apiece. Based upon this analysis, the traffic to those four ports should receive further analysis.
An important step when performing stack counting is ensuring that identification of data points with uncommon values for the selected feature actually are worth further investigation. In the example, destination ports of traffic going to a server were used, which makes sense since the server should primarily be running applications that communicate on set ports.
The use of source ports on a server or destination ports on a client machine, on the other hand, would produce meaningless results for stack counting. Since clients use a random high number port when initiating a connection to a server, the fact that only one piece of traffic uses a particular port is meaningless. When performing stack counting, it’s important to choose a feature where benign samples are expected to have values that are clustered into one or a few bins.
Conclusion: Statistical analysis for incident response
The clustering and stack counting examples in the previous section represent only a few of the simple algorithms that can be applied to incident response. Data science is extremely good at extracting patterns from and identifying anomalies in massive quantities of data, which is a common problem when starting an incident response investigation.
When developing an incident response methodology, and when planning out threat-hunting exercises, it’s important to have processes and tools in place to allow the team to operate efficiently. Monitoring solutions are designed to provide massive amounts of data to an analyst, but it’s also important for that analyst to be able to sift through that data to differentiate indicators of compromise from random noise. Implementing statistical analysis solutions can help with filtering data to bring the most important features to the analyst’s attention first.
Learn Incident Response
Sources
- Introduction to K-means Clustering, Oracle Data Science Blog
- Machine Learning to Cluster Malicious Network Flows From Gh0st RAT Variants, Trend Micro
- Four Common Threat Hunting Techniques with Sample Hunts, LinkedIn


