Wireshark for incident response 101
Wireshark is a freely available tool for network traffic analysis. It can be used to either analyze saved packet capture files or perform live traffic capture of packets flowing over the network, including support for promiscuous traffic capture.
While Wireshark is useful for its ability to capture network traffic, its traffic dissection capabilities are what makes it invaluable for incident response. The creators of Wireshark have put a great deal of effort into making the Wireshark user interface as intuitive as possible and have provided a great deal of built-in functionality for viewing and analyzing network traffic data.

Earn your CMMC certification
Register for a boot camp and become a Certified CMMC Professional (CCP) or Assessor (CCA)!
Using Wireshark for IR
Since most malware and cyberattacks use the network, the ability to analyze network traffic data is invaluable for incident response. This section looks at some of the basic capabilities of Wireshark and their applications and potential utility for IR.
High-level awareness
Wireshark is a great tool for achieving high-level awareness of the types of traffic in a packet capture or flowing live over a network.
The screenshot above shows a sample of Wireshark’s default view. Each line summarizes a packet, and packets are color-coded based on protocol and other attributes. The colors in the capture above make it easy to differentiate DNS traffic (blue) from HTTP (green).
Wireshark also includes visual cues for unusual packets. For example, RST packets in TCP are colored red, making it easy to see if there is anomalous behavior on the network (in this case, a possible scan). Simply by scrolling through the packet summaries, it’s possible to get a rough idea of the mix of traffic in a capture and identify some potential abnormalities that deserve further investigation.
Statistical data
Wireshark also provides a wealth of high-level statistical data regarding a packet capture. These statistics have their own Dropbox menu in Wireshark’s menu ribbon.
The screenshot above is accessed via Statistics → Conversations. This tab summarizes the conversations between different IPv4 addresses.
This is useful for identifying if unusual connection patterns exist within a network. For example, a single machine connecting with a number of different systems within the network may indicate attempts at scanning or lateral movement.
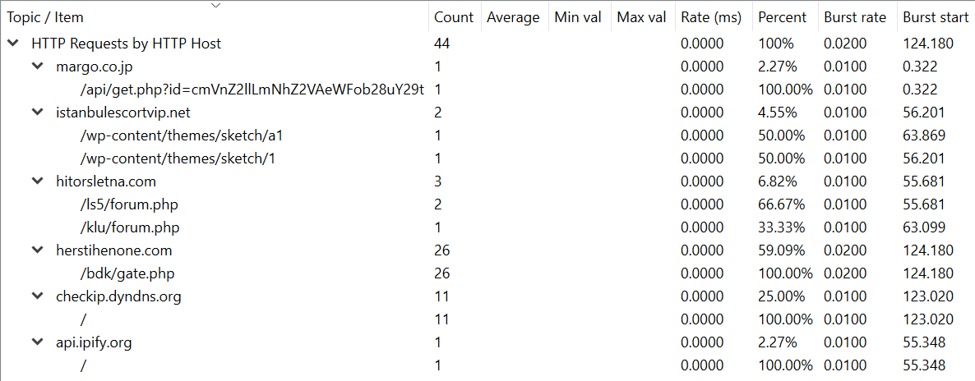
The screenshot above is from Statistics → HTTP → Requests. As shown, it lists the HTTP hosts contacted within a packet capture. This can be useful in checking if an organization’s DNS blacklist is missing any important entries based upon connections to suspicious domains.
Packet-level detail
At the other end of the spectrum, Wireshark is also excellent for diving deep into the details of the traffic flowing on the network. By default, the Wireshark GUI includes packet details in a frame at the bottom of the screen.
The screenshot above is of an HTTP request associated with the OnionDuke malware. As shown, Wireshark provides a breakdown and interpretation of all of the data being sent at each level of the networking stack.
In this particular case, the HTTP detail is invaluable for analyzing the malware sample. OnionDuke sends its command-and-control data as Base64-encoded data embedded within an HTTP URI, as shown above. Wireshark makes it easy to detect this and to extract the HTTP URI for decoding and analysis.
Detailed filtering
In large packet captures, even Wireshark’s packet summaries can be overwhelming. It can be difficult to identify a single packet of interest in thousands or even millions of packets. This is where Wireshark’s filtering capabilities become invaluable.
Wireshark offers high-level protocol filtering, like that shown above. In this case, using the built-in http filter extracts and only shows packets containing the HTTP protocol. Since HTTP is a common protocol for delivering malware and carrying command and control traffic, being able to drill down into that particular protocol can be useful for focusing incident response efforts.
Wireshark filters can be combined using Boolean logic, making it possible to create complex filter expressions. This enables incident responders to filter for things even if they don’t know exactly what they’re looking for, by filtering out everything that is not of interest.
Wireshark filters aren’t limited to protocols; they also include fields that are included in each type of packet. The screenshot above filters for HTTP traffic containing the Host field, making it easy to identify HTTP requests. It is also possible to filter for certain values of a field, like http.host == google.com, to drill down into traffic to and from a particular domain.
Modifying views
The screenshot above shows traffic filtered for HTTP packets containing host data. However, the default columns in Wireshark don’t include this field, making it necessary to look at packet details to see the value of this field.
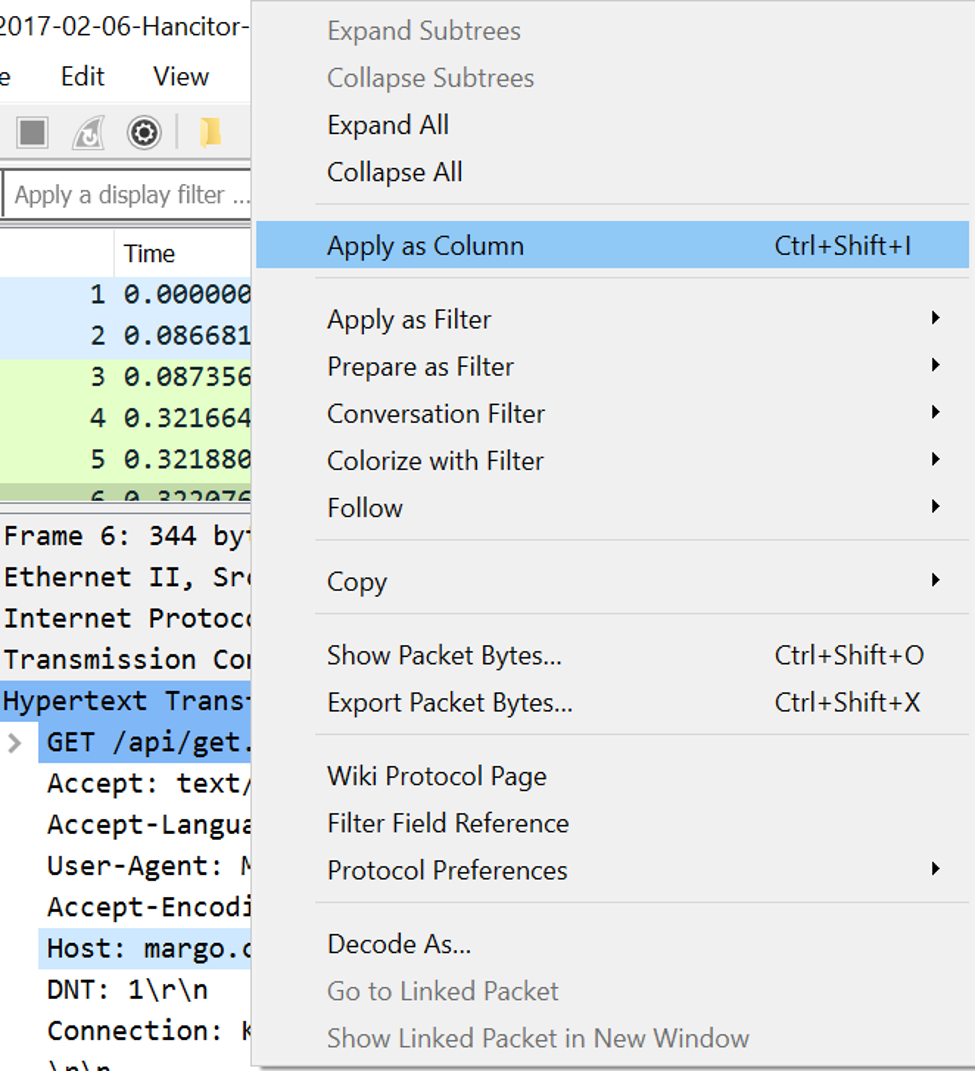
However, Wireshark also makes it easy to add a particular value as a column in Wireshark. The screenshot above shows the process of adding the HTTP Host field to the default view.
As shown above, the filtered traffic now includes a column for HTTP hosts. This is doable for any field in a packet, which is extremely useful when searching for abnormalities in a certain type of traffic in a capture.
Following conversations
Wireshark shows data at the packet level in its default view, but most conversations between machines span multiple packets.
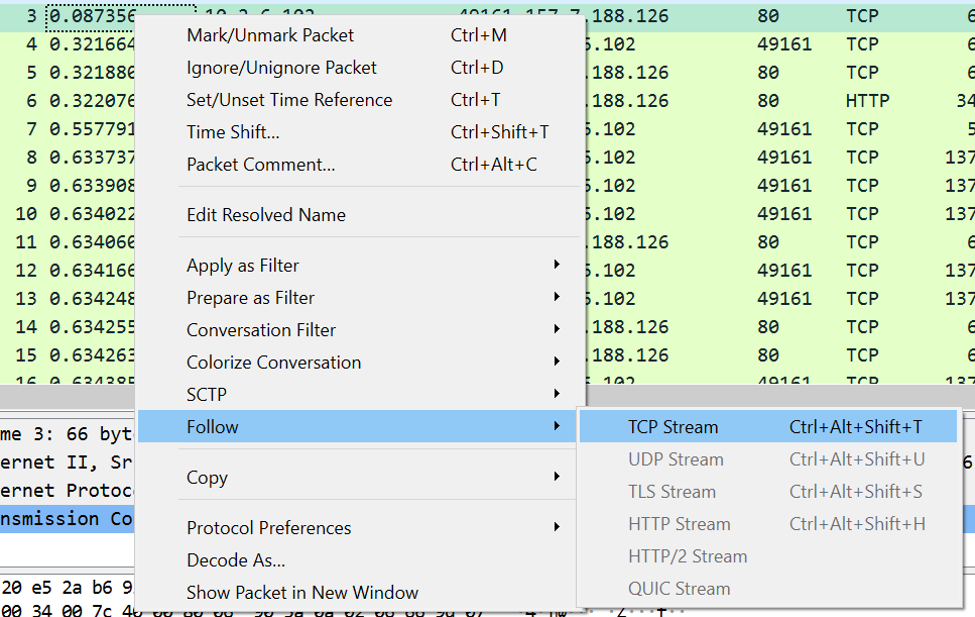
However, Wireshark also enables following a complete conversation. The screenshot above shows the process of setting this up.
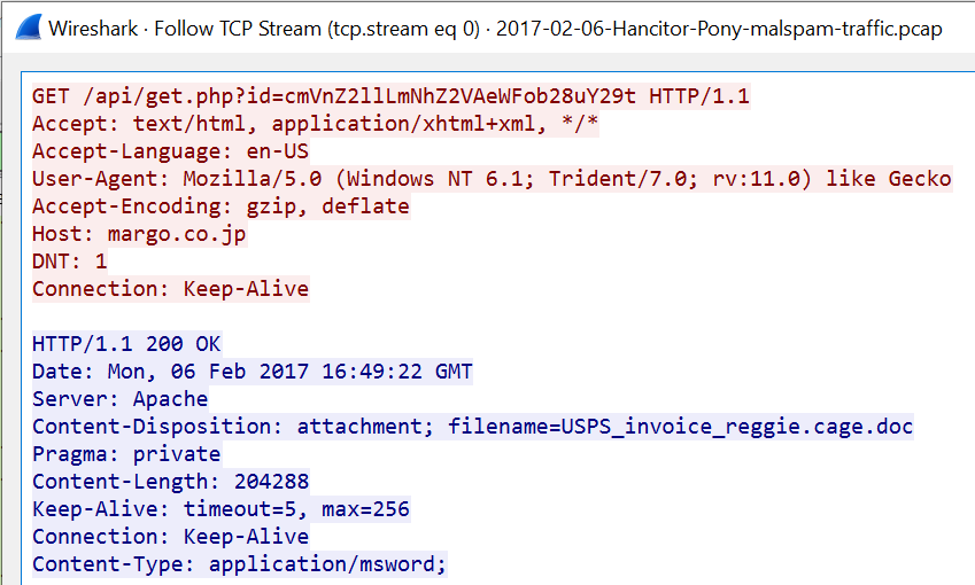
The screenshot above shows a followed TCP stream and contains all of the printable ASCII text from the packets. This is useful for text-based protocols like HTTP, but Wireshark also allows following streams in hex or other formats more suited to other protocols.
Following TCP streams is useful for quickly determining what is going on in a particular conversation. In this case, an HTTP request to margo.co.jp results in a webpage carrying an MS Word file. This conversation deserves further analysis to determine if this Word document contains macros or is otherwise malicious.
Extracting files
It’s possible to manually extract a file from a traffic capture in Wireshark, but it’s a lot of hard work. It’s much easier to use Wireshark’s built-in file extraction capability.
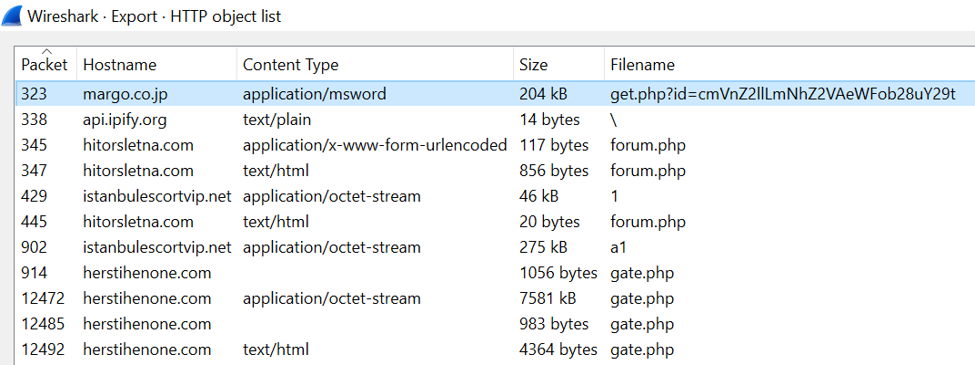
The screen above can be reached via File → Export Objects → HTTP. As shown, this screen lists all of the files carried in HTTP traffic within the packet capture. Files can then be saved to disk individually or as a group for further analysis.
Conclusion: Getting started with Wireshark for IR
Network traffic is a valuable source of data for incident response. Most cyberattacks occur over the network, so collection and analysis of network traffic logs can provide a trove of valuable data about the current state of a network and past intrusions.
Wireshark is the most popular tool for network traffic analysis because it provides an intuitive user interface and a ton of useful functionality under the hood. The examples given in this article constitute only a small sampling of its abilities and possible applications for IR.
Learn Python for Pentesting
Sources
- 2017-02-06 - HANCITOR/PONY MALSPAM - SUBJECT: SHIPPING INFORMATION FOR PARCEL 570754521, malware-traffic-analysis.net
- OnionDuke samples, contagio


