Pattern-Based Approach for In-Memory ShellCodes Detection
Introduction
During an analysis, it can be really useful to know some common instructions with which malware, and more specifically shellcodes, achieve their goals.
Learn ICS/SCADA Security Fundamentals
As we can imagine, these sets of common instructions could be used first to locate and later to analyze and/or to identify general threats: embedded or injected code.
In this article, we'll focus on the identification and analysis of Metasploit and some custom shellcodes on the basis of parameters and information coming from brief research and personal experience.
We'll start our analysis from some previously created memory images. Some of these come directly from real incidents that have occurred, while others are specially created.
We'll look at several shellcodes in order to understand exactly how they work and how to recognize them on the basis of characteristics you notice during the analysis of a possible incident, and/or on the basis of instructions that in most cases are performed to make the shellcode as reusable and effective as possible.
It's important however to understand that this is not an exact science and that the techniques used here could work for some situations, but could not be useful for others. Bad guys put in place many techniques to make their code as stealthy as possible, like the use of many alternative instructions to achieve the same result, the use of unnecessary instructions (push reg, pop reg, xor reg, reg) to avoid pattern recognition, and obviously the encoding of payloads (also used to avoid null bytes).
In general, it's always necessary that you put into play your own experience and knowledge to deal with a wide range of situations. This article has no pretensions to cover every possible eventuality in the identification of malicious shellcodes (just because of the concepts expressed above, this would be impossible), but presents an approach based on the creation of recognition of patterns based on a particular behavior of a service (such as listening port to a non-conventional) and/or on the research for those operations that shellcode must necessarily run to be effective (such as the recovery of the IP, since with the instruction 'mov eax,EIP' it's still not valid :] ).
It's equally important to understand that the experience and the skills of the analyst are very important (and irreplaceable) to quickly identify false positives.
Try to Find What You See
Sometimes it can be quite easy to locate the exact point of malicious code. This is because the effect of its execution is evident during the first general analysis. This example takes the assumption that the payload is not encoded. Let's start with a previously generated memory image named "win.raw":

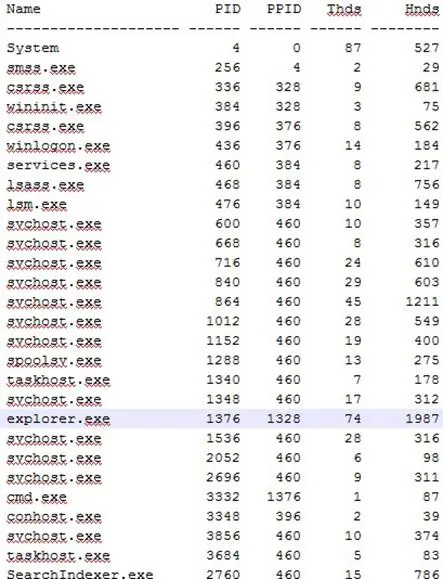
The suggested profile is Win7SP0x86. We can subsequently retrieve all running processes making a "pslist" command. The following is the result:
We can now have a look at the connections state:

It's possible to quickly identify something strange with PID 2760. It's listening on port 5555. We can dump the process to have a deeper view and to investigate it:

The file with a HEX editor looks quite strange (marked in red in the screenshot below):
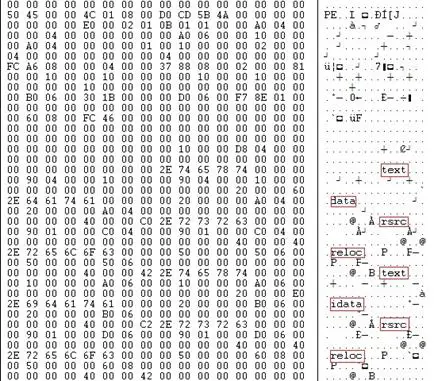
Sections appear to be duplicated. The executable has been modified in order to execute some kind of code first and to land to the original code later.
In this case, if we want to build a custom rule to find a specific part of the code, we can imagine how a specific 'asm' part of this code could look, and specifically the part where the code goes to bind to the port to the interface in order to listen on 5555.
The code should look like:
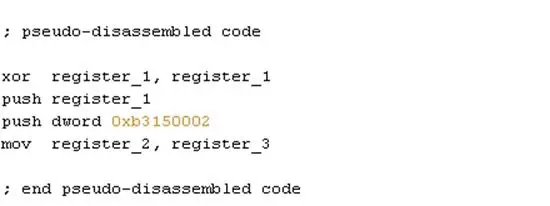
The instruction "push dword 0xb3150002" will be my custom pattern to find.
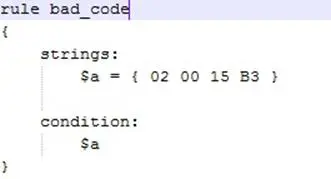
We can so write this signature rule for the YARA engine:
And to start volatility with the following syntax using the YARA scan feature, perform a search on the entire image:

Obtain after a while the following result:

Something is found loaded in the wininit.exe area (PID 384).
We go to dump wininit.exe as well to have a look at what strange monster is inside, and I saw the same signature.
This is what has been obtained:
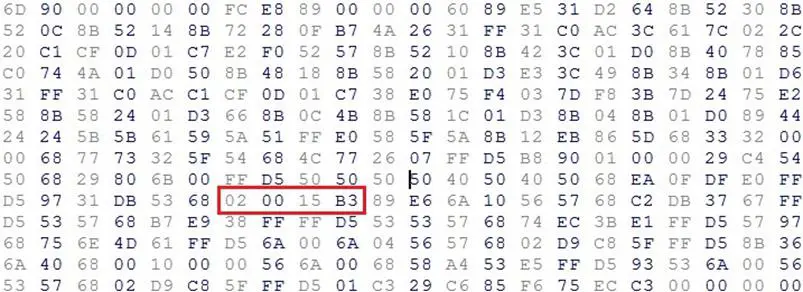
The start point of this code is quite easy to find. We can now copy and paste the hex and go to disassemble this to have a clearer view.

And finally we have the disassembled shellcode with my comments in green:
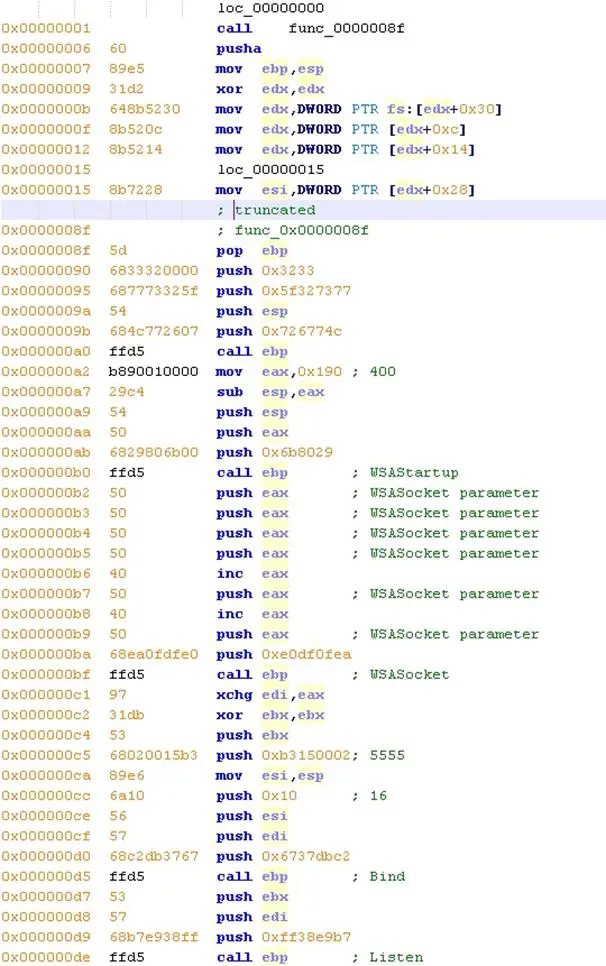
EE == Encode Everything (as 'Goph' said)
Very often, locating shellcodes on the basis of "what we see" is not so easy because of both real operations performed by them and the use of encoded payloads used to avoid fast signature detection and identification.
Polymorphism and other code obfuscation techniques are the norm today in malicious code.
The process to make a polymorphic payload typically includes encoding a payload like the one just seen and to insert a decoding stub before the encoded code.
The following is a general image which represents a polymorphic mechanism to clarify the general work load:
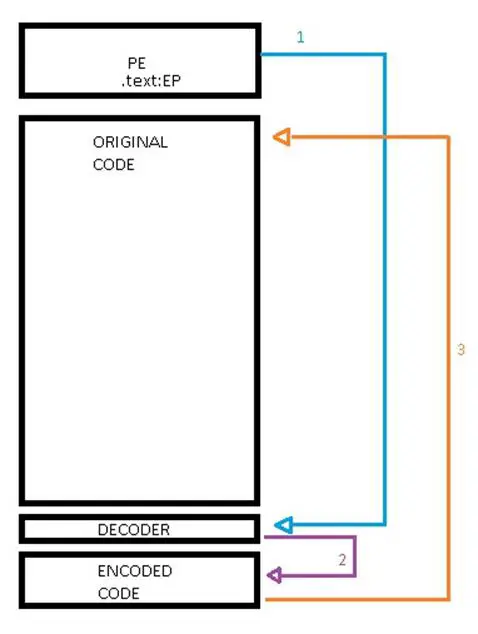
The most used mechanisms to generate polymorphic shellcode are XOR encoders and XOR additive feedback encoders.
In general, it's impossible to talk about polymorphic shellcodes without speaking about the famous Shikata-Ga-Nai encoder, a polymorphic XOR additive feedback encoder available with the Metasploit framework.
Shikata-Ga-Nai
This encoder offer several features that combined can provide a good level of protection, and between these there is the use of different permutations of instructions for each operation.
This means that for the same set of instructions, we will have always a slightly different result.
For example, having a look at the dissassembled instruction below, at 0x0000000c we have a "sub ecx,ecx" to zero the register, represented as "x29xc9".
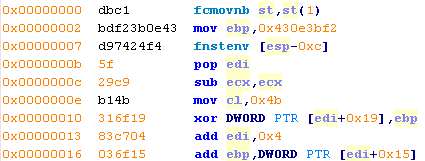
The same instruction can be represented with different values, for example "x31xc9", "x33xc9", "x2bxc9".
Let's take another example with a real Shikata-Ga-Nai encoded shellcode.
The following is the initial set of instructions of the same encoded payload.
Look at the red.
#####################################

#####################################

#####################################

Instead of referring to the payload itself to locate an encoded payload, we can in this case focus on some istructions needed by the shellcode to properly work.
We have to consider that a shellcode must be as reusable as possible, and for this they generally need to know where they are during the execution.
In a nutshell, they need to find the IP (a process called GetEIP or GetPC).
Some steps the code has to achieve to be effective are:
- Find EIP
- Call the decoder stub
- Retrieve addresses of functions
- Exec payload (bind shell)
A mechanism to get EIP is to use some special FPU instructions.
We can always have a look at the image presented before:
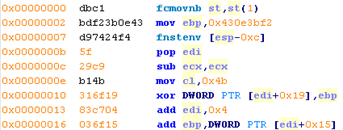
The instruction at 0x00000007 stores FPU environment values to the specific memory area.
The next instruction assigns the register to the EIP value, so the routine achieves the need to find EIP.
Because the fnstenv instruction is a dependency of this algorithm, we can use it to build a new, very simple rule like this:
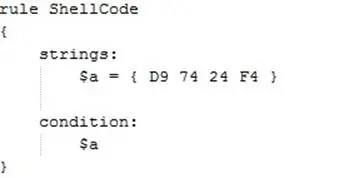
In order to locate our "Shikata_Ga_Nai" shellcode:

The interesting disassembled code of this stage is the following, with my comments in green:
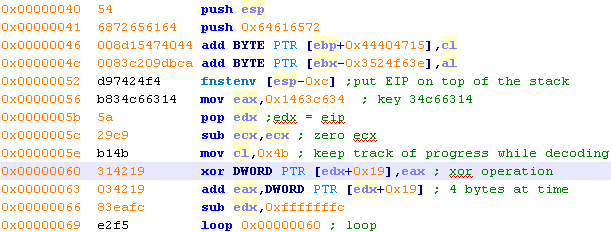
CALL4 DWORD XOR
Call4 DWORD XOR is an encoder present in the Metasploit framework. It's quite easy to detect because of its common instructions.
Looking at the encoder source code:

It's quite simple to make our YARA rule.
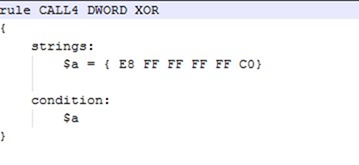
As already mentioned, the bad code must get the value of the instruction pointer.
There are different techniques that can be used to get the value of the instruction pointer on x86, however, most of them rely on the use of call instruction.
These instructions are generally composed of high ASCII bytes like 0xe8 or 0xff.
This is the case of this algorithm and others. With the YARA rule above, we can try to search for evidence of a so encoded shellcode as well.

Something We Have to Look For
As explained above, the first step in most decoder stubs is to use a set of instructions to retrieve the location of the instruction pointer. This is because the decoder most likely will have the encoded data after the decoder stub and will need to know where it is.
If the decoder stub knows the address, it knows also where the encoded data is. Retrieving the value of an instruction pointer is a challenge usually addressed with a series of common instructions, described in the following sections.
GetPC Code
A reliable shellcode should avoid any hard-coded absolute addressing. The decryption routine has to find a way to dynamically find the address of the encrypted payload in the target's address space. This is accomplished by the so called "GetPC" code. GetPC code should be among the first few instructions of the bad code, and for this, locating the GetPC instructions often means to locate the start of the decryption routine as well.
Call 0x5
The easiest and the most common way to implement Get PC code on x86 is using the CALL instruction.
Since CALLs push the next address on the stack, shellcoders just need to retrieve it with a POP and they will get the address.
The corresponding asm of a sample code should look like the following:

And this is its opcodes:
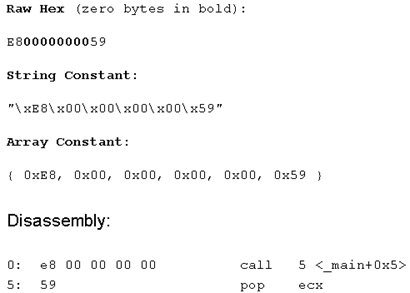
A YARA rule for this pattern would look like E8 00 00 00 00 5? (considering the possibility to pop different registers). Note that this method can not be used in many cases because it contains null bytes. This could be interpreted as a string terminator.
Call 0x4
The asm for a call $+4 method to recover the memory position would look like this:

And equivalent opcodes would be:
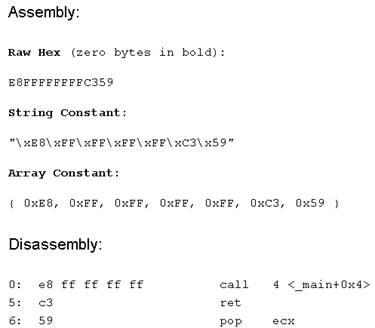
A generic YARA rule to look at this set of instructions could be E8 FF FF FF FF C? 5?
Jmp / Call / Pop
To quickly understand the jmp-call-pop method to retrieve the address of the current location, a simple code example could be useful:
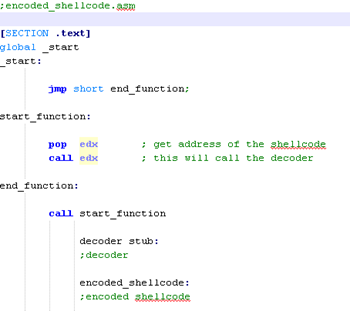
The asm of a real shellcode making use of this method would look like this:
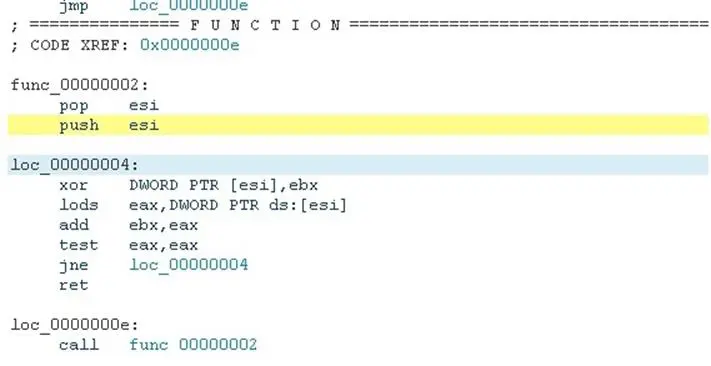
At loc_00000004 looping instructions start.
We must considering these for our rule that could appears like EB ?? 5? [5-15] E8 ?? FF FF FF…
FSTENV
When we discussed the shikata_ga_nai encoder before, we saw a trick to get the location of the shellcode.
This trick is based on FPU instructions. First executing any FP (floating point) instruction on top and then FSTENV PTR SS: [ESP-C] will result in getting the address of the first FP instruction.
If the first FP instruction is the first instruction of the code, you will get the base address of your code.
This address will be stored at 0xC offset. Using a common POP instruction, you can put this address in one register. Refer to the previous section about shikata_ga_nai for an example of this code.
Obviously, searching for the opcodes of FSTENV [ESP-0xC] can help to find bad code based on it.
Assembling this instruction, we'll get:
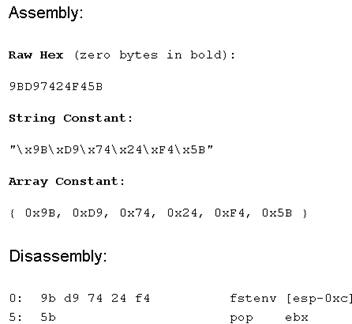
A quick YARA rule to extract possible evidence related to an encoder, making use of fstenv, would look like D9 74 24 F4 5?
GetPC SEH Based
Another way to have a GetPC code is through the use of Windows Structure Exception Handler (SEH). When an exception happens, Windows generates an exception record that contains the necessary information for handling the exception, including the value of the program counter at the time the exception was generated. This information is stored on the stack and could be retrieved by the shellcode registering a custom exception handler. The following are the steps needed to use this method:
-
Register a custom exception handler
-
Trigger an exception
-
Extract the absolute memory address of the faulting instruction
This technique is however not used much anymore and is considered "old" because Microsoft, on a newer version of its system, has added additional controls to be sure the SEH chain is not corrupted before transferring control to it.
Finding Kernel32 Base Address
In Windows, user-mode API's are exported as objects that are mapped into the process space during runtime. The common names of these objects are .dll (Dynamically Linked Library). The only .dll that is guaranteed to be mapped into a process space is kernel32.dll. In order to be reliable and reusable, shellcodes must dynamically locate some functions, typically the LoadLibraryA and the GetProcAddress. If the bad code has access to these two functions, it can load any library on the system and find any exported symbols. Both of these two functions are exported by kernel32.dll, so we expect the shellcode has to achieve these two goals:
-
Find kernel32.dll address
-
Parse PE of kernel32 and search for LoadLibraryA and GetProcAddress functions.
PEB
One of the most common methods to retrieve the kernel32.dll base address is to make use of a Process Environment Block (PEB). The operating system allocates a structure for every running process that can always be found at fs:[0x30] within the process. The PEB structure holds information about the process and the image and regarding loaded modules mapped into process space. The order list of initialized modules has been always constant (up to Windows 7), and kernel32.dll has been always the second module to be initialized (after ntdll.dll) in the InInitializationOrder list.
A typical set of instructions to locate the kernel32.dll base address in all Windows operating systems up to Windows Vista has been the following:

This method works for all version of Windows from 2000 including Vista. However, due the new kernel structure of Windows 7, a new module called kernelbase.dll is loaded before kernel32.dll as it appears in the second entry of the InInitializationOrder module list.
A way to retrieve the kernel32.dll in a more reliable way in all Microsoft systems is to parse the InMemoryOrder module list instead of the InInitializationOrder module list, resulting in these instructions below:

Two quick patterns could so be extracted by these techniques in order to find the instructions used to locate the kernel32.dll base address through PEB:
-
64 8B ?? 30 8B ?? 0C 8B ?? 1C
-
64 8B ?? 30 8B ?? 0C 8B ?? 14
SEH
Another reliable method to retrieve the kernel32.dll base address is to exploit the Structured Exception Handling (SEH). This technique takes advantage of the fact that the default Unhandled Exception Handler uses a function that exists in kernel32.dll. Walking through an SEH chain starting from the higher entry fs:[0], we can list all installed Exception Handlers until we reach the last one. At the end of the SEH chain (at the bottom of the stack), there is a default exception handler that is registered by the system for every thread. The shellcode can so start from FS:[0] and walk the SEH chain until reaching the last SEH frame, and from there we get a pointer into kernel32.dll.
This is an example code:
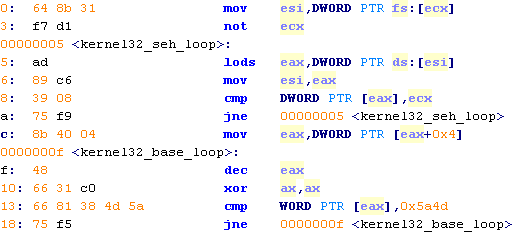
When the last exception handler is reached, the address of the function pointer can be used as a starting point for walking down searching for a magic "MZ" (cmp WORD PTR [eax,0x5a4d]). Once a match is found, we can assume that the base address of kernel32.dll is found.
We can take "kernel32_base_loop" as our base to build a rule:
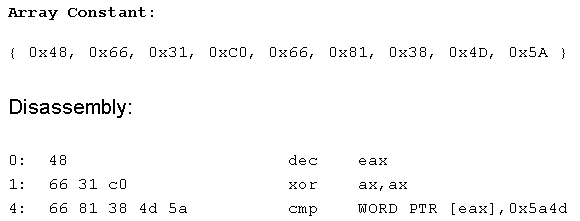
The full pattern could appear:
8B 40 04 48 66 31 C0 66 81 38 4D 5A
TEB POINTER
Using a pointer stored in the Thread Environment Block (TEB), it's possible to extract the address of the top of the stack. Each thread has its own corresponding TEB and can be accessed referencing fs:[0x18]. The top of the stack of threads can be found at 0x4 into the TEB. Starting from here, 0x1c bytes into the stack holds a pointer to somewhere in kernel32.dll. Walking down once again like in the SEH method, we can search for the magic "MZ" string. Once a match is found, we can assume that the base address of kernel32.dll is found.
This is an example of code:
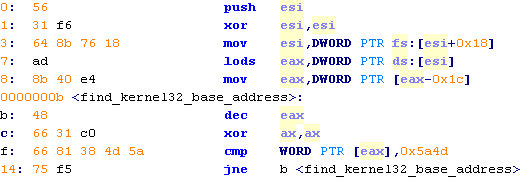
And this is a hypothetical rule:
8B 40 E4 48 66 31 C0 66 81 38 4D 5A
Handling False Positives
We could write a book about a topic of gender, and generally each case has its peculiarities. The skills of analysts generally make the difference. Obviously no method is immune to false positives.
The recurrence of known instruction patterns within licit code will be reported as suspect, and it will have to be deeply analyzed.
Personal experience and the knowledge of instructions friendly to shellcoders will certainly help a lot.
A simple instruction like this for example:

will appear in shellcodes like this:

in order to avoid null bytes. XOR, in fact, is a big friend of shellcoders and should be certainly to be considered a lot while viewing dumps or while creating a custom rule.
Other instructions used in shellcodes are:
- add
- dec
- inc
- mov
- jmp
- push
- pop
- cmp
- test
- jne (usually used after a cmp or test)
- jnz (testing something equal to 0)
- lods
An example of a dump vol search that returns false positives with these rules may be the following:
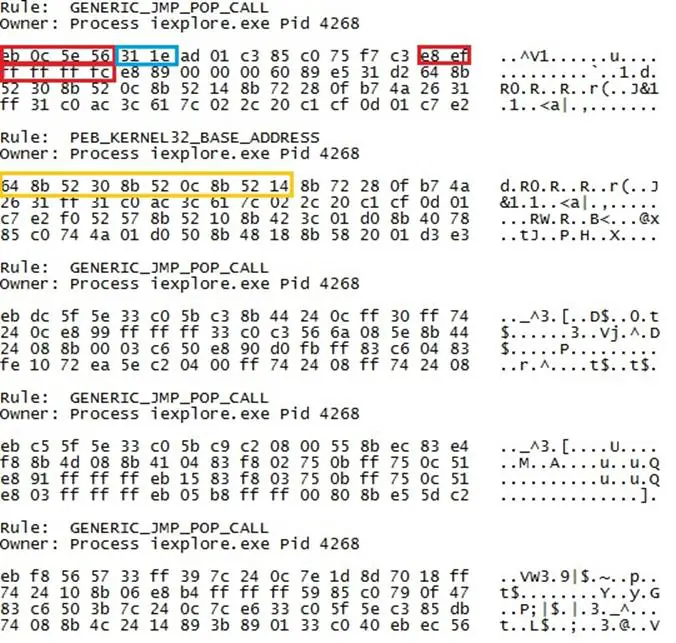
Here we have five results. The first and second results are a "GENERIC_JMP_POP_CALL" and "PEB_KERNEL32_FIND_ADDRESS".
With this in mind, we can immediately concentrate on these two, as they appear definitely related and perform a full dump of processes.
Finally, another factor that we could to take into consideration is the XOR instruction of the first mem dump that is most probably related to the cycle of decryption.
Conclusion

Get your free course catalog
Malicious code detection can really be a challenge. Besides the use of automated tools for the discovery and recovery of malicious code, it can often be very useful to build our own rules on the basis of what we see or on the basis of those instructions that we know must necessarily be completed by malware. However, it's important to know that shellcode and malware writers typically refine their strategies more and more to stay in the shade as much as possible and go unnoticed, and could nullify or reduce the effectiveness of our research with more or less complex techniques.


