The basics of IDA pro
IDA Pro is the best disassembler in the business. Although it costs a lot, there's still a free version available. I downloaded IDA Pro 6.2 limited edition, which is free but only supports disassembly of x86 and ARM programs. Otherwise, it supports a myriad of other platforms, which we won't need here.
Learn Network Traffic Analysis for Incident Response
When IDA Pro is first loaded, a dialog box will appear asking you to disassemble a new file, to enter the program without loading any file, or to load the previously loaded file. This can be seen below:
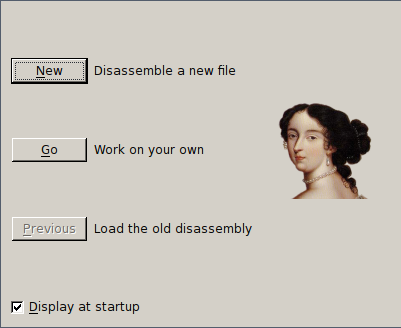
We'll choose to disassemble a new file. We'll select the reverse Meterpreter executable that we previously created with Metasploit framework. We can also disable the "Display at startup" checkbox in the bottom of the window presented on the picture above so that IDA Pro runs only when we want to use it. I guess whenever we've been working on some file already, it's best to click on the Previous button to open one of the files we've been working on in the past.
Upon opening the executable, IDA Pro will automatically recognize the file format of the executable: in our case, it is a PE Windows executable. It will also recognize the architecture the executable was compiled against. This can be seen on the picture below, where the Processor Type of "Intel 80x86 processors: metapc" is detected. The processor type specifies the processor module that will be used to disassemble the executable. The processor modules are located under IDA Pro's procs directory; in my case, the following modules are available: arm.ilx and pc.ilx. Usually, the executable architecture and processor type are recognized successfully and we won't need to change that in the presented window.
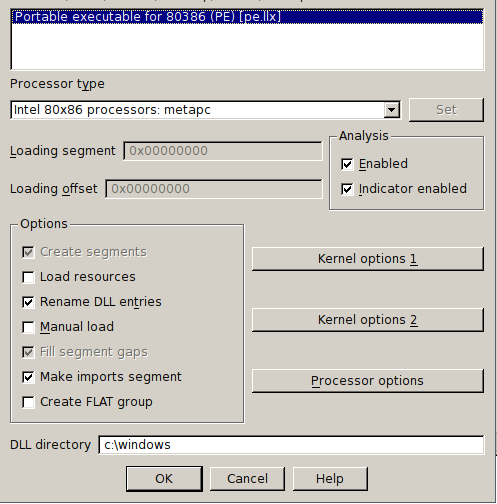
The list of file types generated from the list of potential file types is located in IDA Pro's loaders directory. IDA Pro will automatically present the file types that can be used to work with the loaded file. Any file loader that can recognize the analyzed file will be presented and we will be able to choose any of them. On my version of IDA Pro, the loaders directory contains the following files: dbg.llx, elf.llx, macho.llx, pe.llx. In our case, it was the pe.llx that was able to recognize the analyzed file and display itself as the "Portable executable for 80386" option.
After we click on the OK button, IDA Pro will load a file as if it was loaded by the operating system itself.
Database files
Upon opening a new file to analyze with IDA Pro, it analyzes the whole executable file and creates an.idb database archive. The .idb archive contains four files [1]:
- name.id0 - contains contents of B-tree style database,
- name.id1 - contains flags that describe each program byte,
- name.nam - contains index information related to named program locations,
- name.til - contains information about local type definitions
All of these file formats are proprietary and can only be used in IDA. Once the .idb database has been created for a specific executable, IDA won't need to analyze the program again when we load it later. Moreover, IDA doesn't even require the executable anymore; we can now work with just the .idb file. This is a useful feature that can be used to pass around .idb files to other researchers without the malicious executable. Therefore, IDA can analyze the executable without the actual executable, and with only the database archive file.
Anytime we're trying to close the currently open.idb database (the currently analyzed executable), IDA asks us if we would like to save changes to the disk. We can choose from the following options:
- Don't pack database: flush changes to .id0, id1, nam and til databases and don't create .idb file.
- Pack database (Store): archives the .id0, id1, nam and til into the .idb archive. Note that the .idb of the previous session is overwritten.
- Pack database (Deflate): the same as the previous option, except the database files are compressed in the .idb archive.
- Collect garbage: deletes any unused memory pages from the database. This can be useful if we want to create a smaller database .idb file.
- Don't save the database: we can pick this option if we don't want to save the changes that we have made.
If we are using the demo version of IDA, we won't be able to save our work, since that function is disabled. If we want to use that option, we can either download IDA Pro 5.0, which is free but outdated, or pay for our own IDA Pro version.
If we saved our work, we can open the database anytime later on and it will load really fast, because it doesn't need to perform the whole analysis of the executable file like the first time. This saves us time and money when analyzing malicious files.
We need to keep in mind that whenever IDA analyzes the executable, it must do quite a lot of work, like parsing the executable's header (in our case, a PE executable header), parsing and creating sections for various executable's file sections that it may have (.data, .code, etc), identifying the entry point of the executable where the code will start executing if we run it, etc.
During that time, IDA will also load and parse the actual code instructions of the executable file into the assembly instructions of the selected processor module. Those assembly instructions are then also showed to the user for analysis. But IDA doesn't stop there; it can also scan the generated assembly instructions to figure out additional information about the executable, like the compiler which was used to compile the executable, the function's arguments, the function's local variables, etc.
All in all, IDA can be incredibly helpful in analyzing an executable by providing various information that we normally would have had to figure out ourselves.
Graphical user interface
The most important and basic part of IDA Pro that we need to understand is its graphical user interface, since we'll probably be using it a lot, as otherwise we wouldn't be reading this article. So far, after we've loaded the meterpreter.exe executable, IDA will look like the picture below:
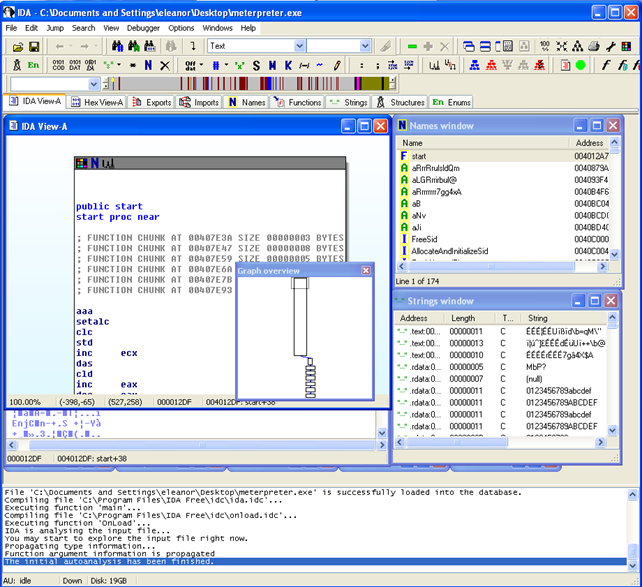
We can see the menu area that contains the menu items File, Edit, etc. This can be used to do anything that is possible to do with IDA; it's just a matter of finding the right option we would like to do. A shortcut for various actions is the toolbar area that provides shortcuts for the same actions we could find in the Menu itself. We can add and remove toolbars by using the View - Toolbars menu option. The next thing is an overview navigator, which is also presented on the picture below for clarity:

It represents the whole memory space used by the analyzed application. If we right-click on it, we can zoom in and out to represent smaller chunks of memory. We can also see that different colors are used for different parts of the memory; this depends on the type of data or code being loaded into that area. At the very beginning of the navigator, we can see a very small yellow arrow that points to the location where we're currently at in the disassembly window.
On the picture below, we're presenting the different views on the gathered data. The data was gathered on the initial analysis of the executable and now we're merely asking IDA to return a specific type of data in its own data view.

We can see that there are a lot of data views available and all of them contain one or more specific information that was gathered from the loaded executable. To open a specific data view, we can go to View - Open Subviews and choose the appropriate view we would like to show. We can also switch back to the default view by clicking on Windows - Reset desktop.
The main view is the disassembly window where we can see the actual disassembled code of the analyzed executable. We can switch between the graph and the listing view that actually represents the same program. The graph view can be used if we want to quickly figure out the execution flow of the current function and the listing view can be used when we want to see the actual assembly instructions.
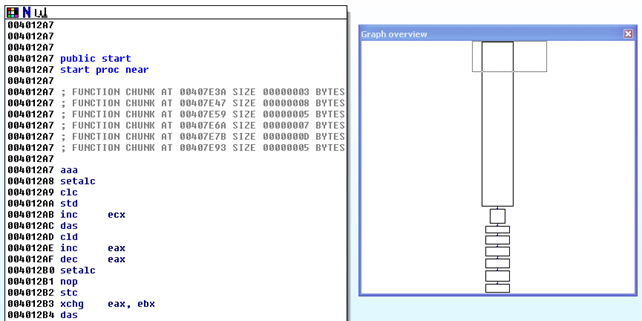
The graph overview of the Meterpreter executable is presented on the picture below:
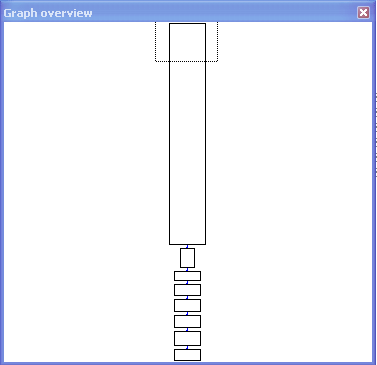
This is just an overview of the program for easier navigation of the piece of code that we would like to be analyzing. In the picture above, we clicked on the start of the program (note the dotted rectangular square). But as it's on the graph overview, we can't see the actual code that will get disassembled. There's an additional window, the graph view window, which goes together with the graph preview window where we can see the disassembled code presenting the corresponding code as in the graph preview, shown on the picture below:
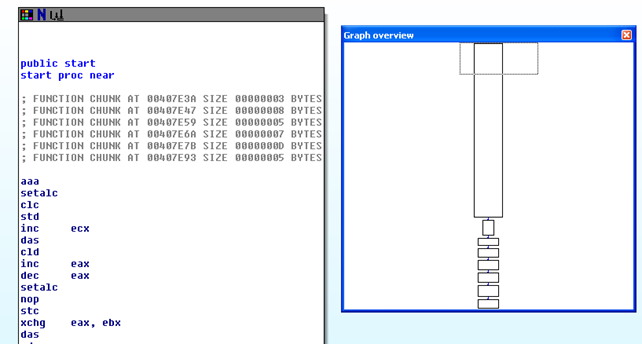
On the left side is a window presenting the actual disassembled code of the beginning of the program. On the right, we can see the overview graph presenting the same beginning of the program. On the graph overview, the program is broken down into logical blocks, where each block is presenting a jump target (as defined in the assembly code). From the graph overview we can also see the logic the program uses while executing. In our case, we can see that there are no decision branches and the program is executed from start to finish without any decisions. The arrows between the blocks can be green, red or blue. In our case, all of the arrows are blue because there's no branching being done. If the program is deciding something at some point and there are two possible branches the execution can go into, we will have a green arrow to note what is taken by default and a red arrow for what isn't taken by default. The graph overview always presents the whole current function of the program, which makes it easy to go to a specific point in the program if the program is overly complicated and the navigation in the listings view becomes difficult.
The listing view of the Meterpreter executable is presented on the picture below:
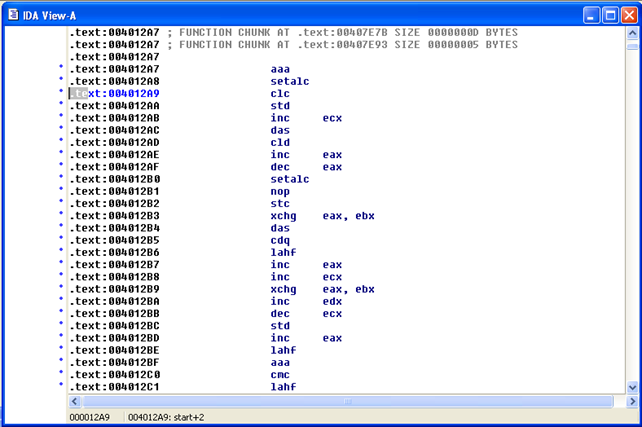
Let's also present another listing window that has a little more going on than the one on the picture above.
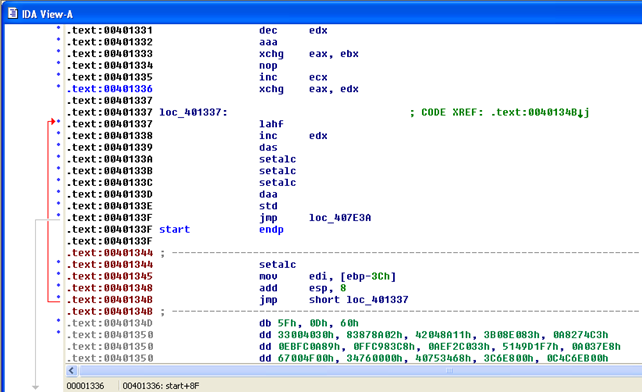
We can switch between different locations in listing view or within the graph view; both of the views will represent the same code at any given time. If we look at the graph and the listings view more carefully, we can see that the listings view also presents the virtual addresses where certain instructions are located, while the graph view hides those. This is because the graph view can be presented more clearly with less information, so virtual addresses are hidden. Nevertheless, if we would like to show those addresses, we can enable them in Options - General - Disassembly and enable the "Line prefixes" option. Those preferences can be seen on the picture below:
On the left side of the listing window, we can see different arrows that show us the branching in the analyzed program. On the line 0x0040134B, we can see the program will jump to the location 0x00401337 and continue the execution from there.
The arrays are of different colors and can be solid or dashed. The solid lines represent unconditional jumps, while the dashed lines represent conditional jumps. In our example, the red line is solid, because the instruction located at that address uses the unconditional instruction jmp.
IDA pro can also figure out the arguments of the function in question. We can't see any function parameters on the picture above but we can see the comments noted with a ';' at the end of some of the lines. Each of the comments lets us know that another instruction is referencing that place in the code. In our case, we can see a cross-reference comment "; CODE XREF: .text:0040134B", which lets us know that the instruction at address 0x0040134B is referencing the current address. So though we already know that the program is jumping from location 0x0040134B to 0x00401337, we often won't be able to tell so easily, which is why the cross-references can be very helpful.
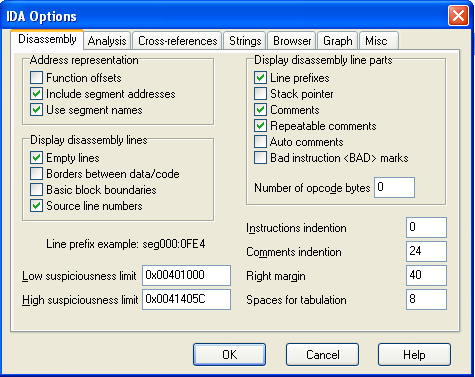
When viewing the instructions in graph mode afterwards, the virtual addresses will be enabled. This can be seen on the picture below where we presented the same picture as above, just with virtual addresses enabled:
In the IDA's default window, there's an additional window that is used to display different messages generated by IDA. Those messages can be outputted by any kind of plugin in IDA or by IDA itself. The messages are there to inform us of different things regarding the analysis of the executable sample. For clarity, the message view is presented below:

Other views
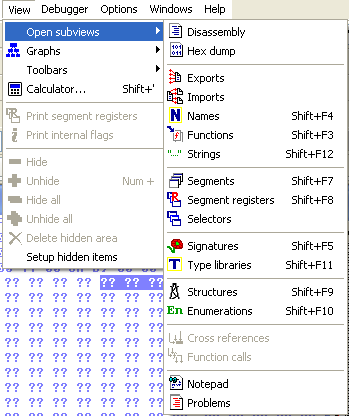
If we go inside View - Open Subviews, we can see many windows that can be shown or hidden and provide us with additional functionality. These can be seen on the picture below:
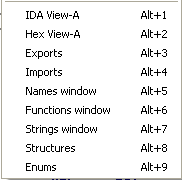
If we go inside the Windows menu option, we can see the currently open windows which we can quickly bring to the front by using the Alt-Num shortcut, where Num is a number. The currently open windows can be seen on the picture below with their appropriate shortcuts:
IDA View-A
We already presented IDA View-A, which is simply the code disassembly of the program.
Hex View-A
The hex view window presents the hex representation of the program. The first hex window is always synchronized with the disassembly view, so it always presents the same virtual addresses. If some bytes are highlighted in either one of the windows they are also highlighted in the other window as well.
Let's first select some text in the IDA View-A. On the picture below, we selected the text "Send request failed!":
![]()
The corresponding Hex View-A will have to have the same text selected as can be seen below:
![]()
If we right-click on the Hex View-A, we can also disable the synchronization of the hex view with the disassembly view. That functionality can be seen on the picture below:

Exports
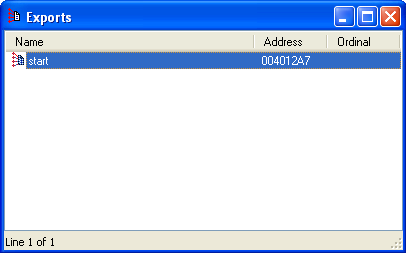
The Exports window lists the exported function that can be used by outside files. Exported functions are most common in shared libraries as they provide the basic building block APIs that can be used by programs running on the system to do basic operations. In our case, there is only one export function named start, which is the executable's entry point.
Imports
The Imports window lists all of the functions that the executable calls that are not contained in the executable itself. This is a common scenario present when the executable is using shared DLLs to do its job. The Meterpreter executable contains the following imported functions:
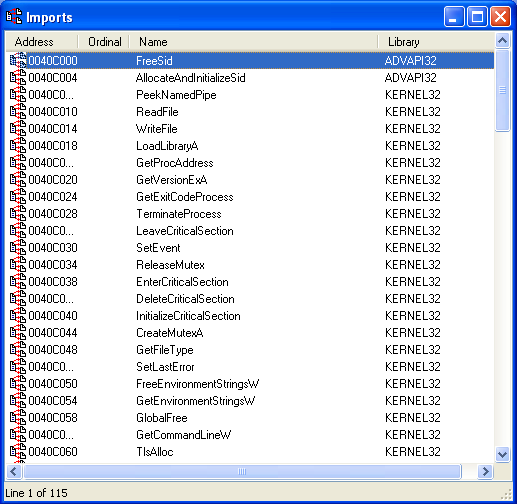
The imports window lists the virtual address of the function, its name, and the DLL to which it belongs to.
We need to keep in mind that the imports window will list only those shared functions that are loaded by a dynamic loader at runtime, but the executable can load dynamic functions by itself using a function call like LoadLibrary.
Names window
The names window displays all the names found within the executable program. A name is simply an alias for a certain virtual address. Usually, each referenced location in the executable will have a name. Referenced locations are named locations where we transfer the execution at branch/call time and also the variables, where we read the data from or write the data to. If there are symbols contained in the executable's symbol table, they are appended to the list in the Names window.
Throughout the disassembled code, we can also notice the names that do not appear in the names window; those are automatically generated by IDA itself. This happens because the symbol table in the executable doesn't contain the relevant symbol, which could be inherited. The automatically generated names usually have one of the following prefixes followed by their corresponding virtual address: sub_, loc_, byte_, word_, dword_ and unk_.
We can use names to quickly jump to various locations inside the program executable without having to remember their corresponding virtual addresses. The names window for the Meterpreter executable can be seen on the picture below:
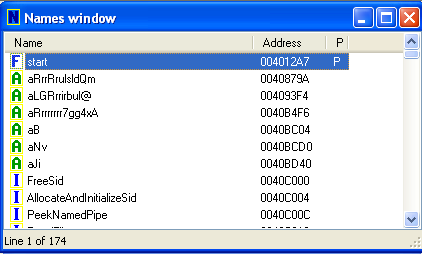
Let's take a look at the start name that points to the 0x004012A7 virtual address location. Also, take a look at the same memory location in the disassembly view; we can see that the start name is indeed located at the specified location as can be seen on the picture below:

We also need to mention different colors and letters present in each line in the Names window. Different letters mean the following [1]:
- F (Function): regular function, which is not a library function.
- L (Library): library function that can be recognized with different signatures that are part of IDA. If the matching signature is not found, the name is labeled as a regular function.
- I (Imported): imported name from the shared library. The code from this function/name is not present in the executable and is provided at run time, whereas the library function is embedded into the executable.
- C (Code): named code that represent program locations that are not part of any function, which can happen if the name is a part of the symbol table, but the executable never calls this function.
- D (Data): named data locations that are usually global variables.
- A (Ascii): ASCII string data that represents a string terminated with a null byte in the executable.
In the Meterpreter executable, we can see that the start name is a regular function, which means it's an actual function in the executable. There are also quite a lot of ASCII strings represented by the letter A. This is normally the case for every executable, since each executable must contain its share of strings. But the Meterpreter executable also uses imported (I) entries that correspond to the imported library functions, which are also needed if we want to call functions outside of the executable (located in shared libraries).
Functions window
The functions window lists all the functions present in the executable, even though their name was automatically assigned by IDA itself. The names window doesn't do that by default and it also displays other names. The functions window is used solely to display the name of the functions. On the picture below, we can see all the functions used in the Meterpreter reverse executable:
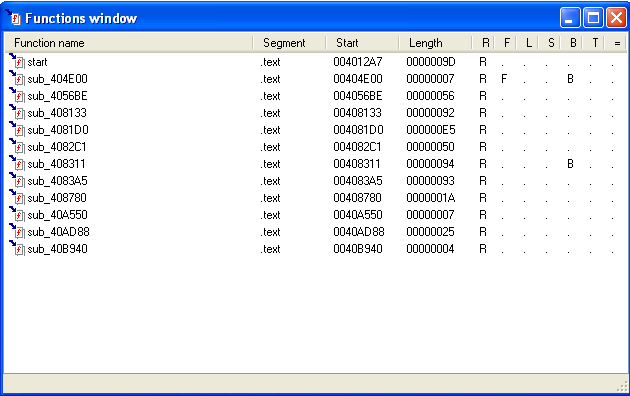
We can see that the function start is located in the .text segment of the executable, that it starts at the 0x004012A7 virtual address, is 0x9D bytes long, and returns to the caller (flag R). The explanation of all of the flags can be found if we right-click on the function on the function window and select "Edit function." The window presented on the picture below will pop up showing the explanation of the flags:
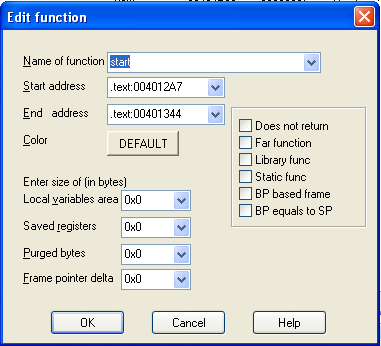
The flags are explained as follows:
- R: whether the function returns to the caller
- F: whether it's a far function
- L: whether it's a library function
- S: whether it's a static function
Strings window
The stings window presents the strings that were found by the executable. Keep in mind that every time we open the strings window, IDA rescans the whole binary and displays them; it doesn't keep them stored in one of the database archives. We can see the strings window with the strings found of the Meterpreter executable on the picture below:
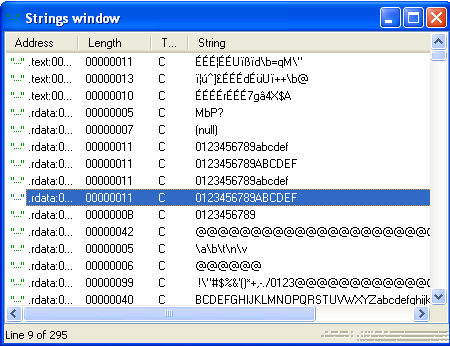
We can control which strings will be presented to us by right-clicking on the strings window and choosing Setup, where we can change various settings that correspond directly to how IDA searches for strings. The setup window can be seen on the picture below:
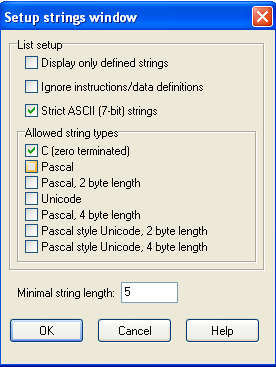
We can see that IDA can scan for various kinds of strings, but defaults to scanning for C 7-bit strings by default. On the picture above, we can also see that the minimum length of the string for it to be displayed in the strings window is 5 characters. We will often find ourselves changing the "allowed string types" to scan for other strings as well, which is good if we have a hunch that the executable uses other kinds of strings
The "display only defined strings" option will cause IDA to display only named strings and hide all the others. If we enable "ignore instructions/data definitions," IDA will also scan for strings in the code and data sections of the executable. This is a good option if we want to find out if there are any strings embedded in the actual code of the executable.
Structures
The structures window lists the data structures that could be found in the binary. IDA uses the functions and their known arguments to figure out whether there's a data structure present in the executable or not. In the case of the Meterpreter reverse executable, IDA didn't find any structures in the executable, which can be seen on the picture below:

Whenever IDA finds a structure, we can examine it by double-clicking on it. Of course, we can also check out the data structure on the Internet, but why would we do that if IDA already provides us with the information we need.
Enums
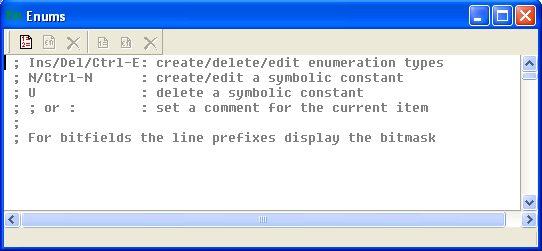
The enums window lists all the enum data types found in the executable. In the case of reverse Meterpreter executable, IDA didn't find any enum data types as can be seen on the picture below:
Segments
The segments window lists all the sections of the binary. In the case of reverse Meterpreter, the sections are presented on the picture below:

We can see four sections here: .text, .idata, .rdata and .data. The .text section starts at virtual address 0x00401000 and ends at the virtual address 0x0040C000. The R/W/X columns are flags that mean: Read/Write/eXecute. The .text section has the Read and eXecute flags set, which is mandatory for the executable to be able to actually execute. It would be worrying if the .text section also has the Write flag set, which would indicate the possibility of self-modifying code that is common in viruses and worms.
Signatures
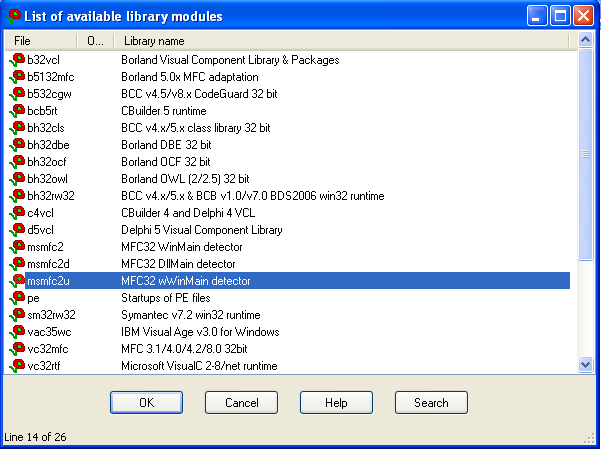
Signatures are used to determine the compiler used for the executable by comparing a lot of known compiler specific signatures to the current executable. IDA will try to apply all of the signatures taken from one of the files in the sigs directory and apply them to the executable. The useful thing about signatures is that the functions will already be recognized and we won't need to reverse engineer the standard functions that are already known, so we can focus more on the actual reversing of the program itself. In the case of reverse Meterpreter executable, IDA isn't able to determine the compiler used to compile the executable, so the warning below is shown:
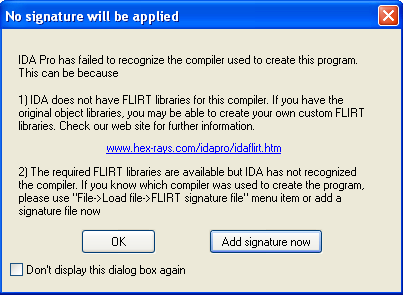
We can click on the "Add signature now" button to select the signatures we would like to forcibly apply to the executable. A list of available library modules can be seen below:
Conclusion
IDA Pro is a very good disassembler that should be used in every reverse engineering scenario. We've seen the basic windows that IDA Pro uses and introduced them on the reverse Meterpreter executable. If we want to master IDA Pro, it's better to completely understand what we've written in this tutorial before moving on to the more advanced stuff.
Learn Network Forensics
Sources
- Chris Eagle, The IDA Pro Book: The unofficial guide to the world's most popular disassembler.


