Hooking IDT
Download the code associated with this article by filling out the the form below.
Once we've already gained access to the system, we can use various post-mortem attack vectors to exploit the system further. There might be various reasons for doing that, but attackers mostly use them for hiding the presence of a malicious code in the system. We can also use them for research purposes, because they are invaluable when trying to find out how the application works or for finding new zero-day vulnerabilities in software. We also need to use them when our system has been exploited and we would like to figure out what the malicious hacker got its hands on; thus it's important to use them in forensic examination of the compromised system.

Earn your CMMC certification
Register for a boot camp and become a Certified CMMC Professional (CCP) or Assessor (CCA)!
To actually use those post-mortem attacks, we need to understand that there are different ways of achieving them. One of which we'll look at in this article is changing the function pointers in relevant function pointer tables, so when a certain function is called, a stub is called instead, which in turn calls the original function. There are also other methods that can be used, like function patching, where we're changing the actual code of the function, which also notifies us when being called by various processes.
In this article we'll present how we can hook pointers stored in the IDT (Interrupt Descriptor Table). The IDT table stores pointers to ISR (Interrupt Service Routines), which are called when an interrupt is triggered. At such point the processor stops doing whatever it's doing and calls the interrupt service routine, which handles the interrupt. There is a lot of stuff that can interrupt a process, like a mouse movement, key press, etc. Note that each processor has its own IDTR register that contains the pointer to the IDT table in kernel memory.
Keep in mind that the IDT table is created by the operating system when it goes from read mode into protected mode upon the booting process.
In this tutorial I'll use WinDbg to attach the whole operating system to it, thus being able to debug the kernel. We can learn how to do that in this article that I wrote previously. We'll be using two virtual machines with one processor and with 1GB of RAM, so only one pair of IDTR/IDTL registers will be present.
IDT table
Let's first present the value of the IDTR and IDTL registers, which can be seen on the picture below; we're showing the WinDbg window, where we've executed the "r idtr" and "r idtl" comamnds, which prints the the IDTR/IDTL values.

Let's also print the beginning of the IDTR table by using the dd command and passing it the pointer of the IDT table and the length to print. Remember that the IDT table is an array of IDT_DESCRIPTOR data structures, each of which is 8 bytes long; therefore there are two descriptors stored in each row printed below.
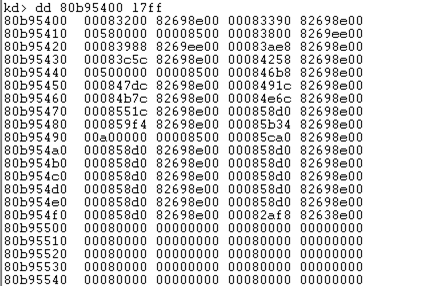
By looking directly at the memory dump, we can't clearly see what's going on, unless we know the fields of the IDT_DESCRIPTOR by heart. Anyway the IDT_DESCRIPTOR is presented below, where the picture was taken from [1].
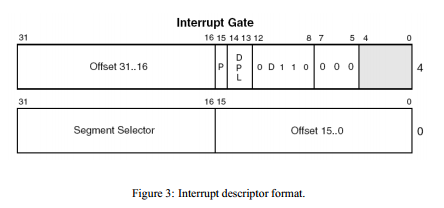
Let's describe the fields of IDT descriptor in detail (summarized after [1]):
- Offset 31:16, Offset 15:0: both fields together form a 32-bit virtual address that points to the interrupt service routine (ISR), which is normally a function; this ISR is called whenever an interrupt occurs, no matter whether it's a hardware interrupt, exception or int instruction.
- P: if set to 1, it specifies this is a valid interrupt descriptor.
- DPL: descriptor privilege level, which can be set to 0 (kernel-mode) or 3 (user-mode); the values 1 and 2 are not normally used.
- D: if set to 1, it specifies the 32-bit interrupt gate.
- Segment Selector: the ID of the code segment (CS) register, which will get used when the interrupt occurs.
 If we would like WinDbg to take care of parsing the interrupts, we can use the "!idt -a" command to print them, which can be seen below. Note that the 0x2e interrupt is important, because it's used for system calls and refers to the KiSystemService. This is the function that provides access to the kernel-mode from user-mode. Newer versions of Windows use sysenter instruction, but the 0x2e index is still used to make a system call with the int instruction.
Let's take a closer look at the 0x2e instruction by printing its memory by using the dd command presented below.

Since the memory bytes are written as little-endian, we need to take that into consideration when trying to discover the values of the fields of IDT_DESCRIPTOR.
- Offset 31:16, Offset 15:0: 0x8268222e
- P: 1
- DPL: 3
- D: 1
- Segment Selector: 0x8
The offset gives us the address of the ISR, the P specifies a valid interrupt descriptor and D specifies a 32-bit descriptor. The DPL (Descriptor Privilege Level) specifies that we can use this descriptor from user-mode, which needs to be true to be able to use system calls to call into the kernel-mode (from user-mode). The Segment Selector is 0x8, which means it's referencing the kernel's code segment. The segments can be printed by using the "dg 0 f0" command as seen below, where the 0x0008 selector specifies the code segment in kernel-mode with base address 0x00000000 and length 0xffffffff.

The Offset address 0x8268222e is added to the base address of the segment descriptor specified by the Segment Selector. Windows is using flat memory model; actually it's using segmentation+paged memory model, but since the segmentation is not being effectively used, we're referring to it as flat memory model. Because the segment registers are all mapped to the same base address 0x00000000, we don't have to specify the segment and offset when working with memory addresses. Therefore the base address of 0x8 segment selector is 0x00000000 and by adding the virtual address 0x8268222e to the segment base address, we get the same linear address: 0x00000000+0x8268222e = 0x8268222e. Therefore, if we would like to hook the interrupt service routine, we only need to change the Offset field in the interrupt descriptor. If it currently points to a function routineA(), we can change it to point to a function routineB() and be done with it.
We mentioned that the user-mode code can call the 0x2e interrupt because it's DPL field is set to 3, which means the user-mode code has privilege to call it. The DPL field can be set to 0x0 (kernel-mode) or 0x3 (user-mode). It would be cool if we can write a script that would print all the DPL values from the IDTR table. We can do that with a simple Windbg script as seen below.
[plain]
.block
{
$$ the address of IDTR table
r $t0 = ${$arg1}
.for (r @$t1 = 0; @$t1 < 0xff; r @$t1 = @$t1 + 1) {
$$ Calculate the address of DPL
r $t2 = @$t0 + @$t1 * 0x8 + 0x5
.printf /D "%xn", @$t1
db @$t2 l1
}
}
[/plain]
The script above reads the value of the IDTR register as its argument and then goes over all 0xff (256) entries and prints it's DPL value. The script can be run by running the command "$$>a<"C:scriptsprintdpl.wds" 80b95400", where the 80b95400 is the address of the IDTR table. The output from the script can be seen below:
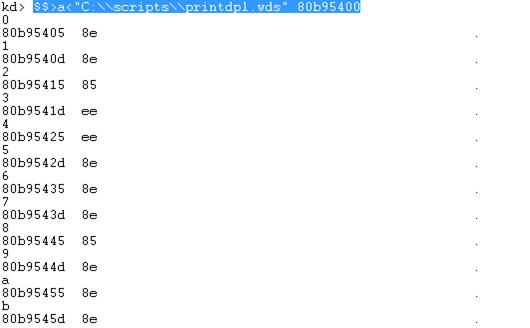
The script is printing the whole byte from the relevant address (offset 0x5 into each entry). The script prints the following numbers, where only the 0xee actually has DPL set to 3 (the DPL bits are presented in bold):
- 0x8e (1000 1110): DPL=0
- 0x85 (1000 1001): DPL=0
- 0xee (1110 1110): DPL=3
If we take a look at the whole output, we can figure out that the only interrupts that we can call from user-mode are the following:
- 0x3 (nt!KiTrap03)
- 0x4 (nt!KiTrap04)
- 0x2a (nt!KiGetTickCount)
- 0x2b (nt!KiCallbackReturn)
- 0x2c (nt!KiRaiseAssertion)
- 0x2d (nt!KiDebugService)
- 0x2e (nt!KiSystemService)
Hooking the ISR in IDT
When hooking the interrupt service routine in the IDT table, we need to achieve the following:
- Write the ISR Routine: we need to write the interrupt service routine that the kernel will call when an intrrupt occurs. The ISR must do some actions that then call the original ISR, so the appropriate action still takes place.
- Overwrite the IDT Pointer: we need to inject our previously written interrupt service routine into the kernel and then overwrite the appropriate pointer stored in the IDT table with the pointer to the injected routine. We'll do that by writing a kernel driver, which we'll load into the kernel at which point the DriverEntry routine will be called.
To hook a routine in IDT, we need to following the steps below
- Get IDT Address: first, we need to get the address of the IDT table, which we can do with sidt instruction. That instruction stores the address of the IDT table in the destination operand, which specifies a 6-byte memory location: 2 bytes are used to hold the size of the IDT table and 4 bytes are used to hold the address of the IDT table. When calling the sidt instruction in the kernel, we must first call the cli instruction to clear the interrupt flag, which causes the maskable interrupts to be ignored. After executing the sidt instruction, we need to enable the interrupts with the sti instruction.
- Get ISR Address: after we've gotten the address of the IDT table, we need to traverse it to select the interrupt we would like to hook. Basically if we want to hook 0x2E interrupt, we can calculate the address directly, since each interrupt is 8 bytes in size: IDTADDR+0x2E*8.
- Overwrite ISR Address: in this step we must overwrite the address for a particular interrupt in the IDT table. We must take the structure of the descriptor into consideration when overwriting the pointer address: this is because the pointer needs to be stored in two halves in the offset00 and offset16 members of the DESC structure.
- Invoke Appropriate Interrupt: after overwriting the address of the interrupt service routine, we need to invoke the appropriate interrupt to see the hooking function getting called. We can do that with a simple program that calls just the "int 0x2e" instruction, just to prove a point. In real life, we want to hook an interrupt that occurs frequently, so our hooking routine also gets called on the interrupt invocation.
Let's first present all the code used for hooking the 0x2e routine, so we can first take a look at the whole thing and later describe it in detail. The whole program used for hooking ISR routines can be seen on my github.
After compiling the module, we need to load it into the kernel by using 'OSR Driver Loader'. At the same time we also need to have DebugView running, which will catch all the kernel messages we've printed with DbgPrint function. When adding the driver to the kernel, its DriverEntry routine will be called, which will in turn call the GetIDTAddress function seen below. Note that I've presented a very simple function, which gets only the address of IDT table.
[plain]
IDTR GetIDTAddress() {
IDTR idtraddr;
/* get address of the IDT table */
__asm {
cli;
sidt idtraddr;
sti;
}
DbgPrint("Address of IDT table is: %x.rn", idtraddr.addr);
return idtraddr;
}
[/plain]
Once the driver has been loaded into the kernel, the address of the IDT table will be printed in DebugView as can be seen below. Notice that the address of IDT table is 0x80b95400, which is the same as we've already seen.
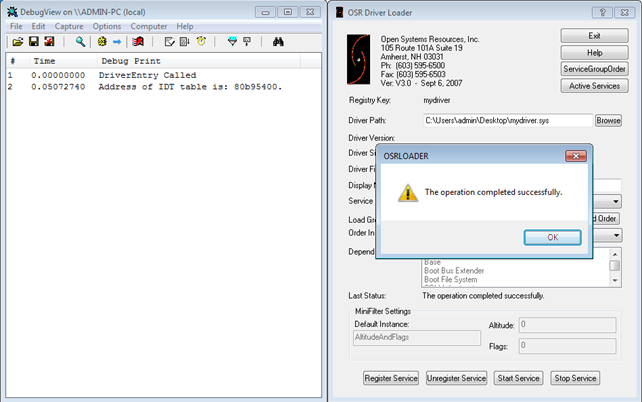
After that we also need to add the code that will get the address of the ISR routine, which can be done with the GetDescriptorAddress and GetISRAddress functions presented above. The code is very well commented and easy to understand, so I won't describe it in detail. In the GetDescriptorAddress function, we're first getting the address of the IDT table after which we're calculating the address of the descriptor we're interested in. We're calling the function by passing it the 0x2e number, which means we want to get the address of the ISR routine of 0x2e descriptor. Let's present the descriptor as it is at this moment, by executing the "!idt -a" WinDbg command. We can see that the descriptor address is 0x8268c22e.

When compiling and loading the driver, the following will be printed into the DebugView. We're printing every memory of the DESC structure, which presents each descriptor. The last line also prints the calculated address of the ISR routine, which is the same as we've already figured out: 0x8268c22e.
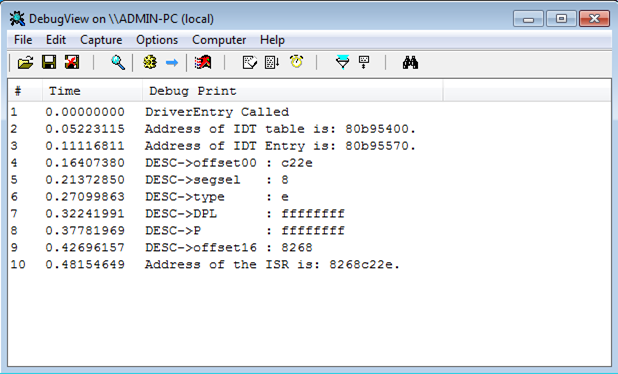
The address of the ISR was calculated by shifting the offset16 member for 16 to the left and adding the offset00 member, giving us the proper address.
At this time we have address of the ISR routine we're interested in. Now, we actually need to hook the ISR routine by replacing the ISR pointer with the pointer to our own routine. But before doing that, we also need to be aware that each processor has its own IDT table, which stores pointers to the same routines. So when an interrupt is triggered on processor 1 or processor 2, the same action takes place. Therefore, when hooking an ISR routine, we need to do so in all IDT tables, so the same routine is called upon triggered interrupt/exception no matter on which processor it's executed. We can do that by using one of the methods below:
- Infinite Loop: we can launch threads in infinite loop, which will sooner or later launch the hooking thread on all processors; this is because the scheduler will assign a certain thread to be executed on the processor that's currently free.
- KeSet AffinityThread: this function allows us to set the affinity mask of the executing thread, which in turn allows us to define a certain thread to be called on a specific processor.
At this point, we have to hook the 0x2e interrupt function stored in the IDT table. The whole function that hooks any interrupt is seen below. It accepts two parameters: the first parameter 'service' is the interrupt ID which we want to hook – in our case this is 0x2e. The second parameter is the address of the hooking function – that is the function which will be called when 0x2e interrupt is triggered.
[plain]
void HookISR(UINT16 service, UINT32 hookaddr) {
UINT32 israddr;
UINT16 hookaddr_low;
UINT16 hookaddr_high;
PDESC descaddr;
/* check if the ISR was already hooked */
israddr = GetISRAddress(service);
if(israddr == hookaddr) {
DbgPrint("The service %x already hooked.rn", service);
}
else {
DbgPrint("Hooking interrupt %x: ISR %x --> %x.rn", service, israddr, hookaddr);
descaddr = GetDescriptorAddress(service);
DbgPrint("Hook Address: %xrn", hookaddr);
hookaddr_low = (UINT16)hookaddr;
hookaddr = hookaddr >> 16;
hookaddr_high = (UINT16)hookaddr;
DbgPrint("Hook Address Lower: %xrn", hookaddr_low);
DbgPrint("Hook Address Higher: %xrn", hookaddr_high);
__asm { cli }
descaddr->offset00 = hookaddr_low;
descaddr->offset16 = hookaddr_high;
__asm { sti }
}
}
[/plain]
At the start of the HookISR function, we're first declaring some local variables, which we have to do in the beginning of the function. We can't declare a local variable in the middle of the function, because it will result in a compile error. After that we're checking whether we have already hooked the ISR routine; if we have, only the message about service already being hooked is printed. Otherwise, we're getting the 0x2e descriptor address and printing it. Then, we're taking the address of the hooking routine and storing the lower and higher part of it into two variables: hookaddr_low and hookaddr_high. At the end we're actually overwriting the offset00 and offset16 members of the DESC structure with the appropriate values: this is where the hook actually occurs. We also have to embed those two structures within the cli and stiinstructions, so they are executed in one go and are not preemptive.
We also have to present the HookRoutine, which is the hooking function. The code of the whole function can be seen below for clarity. We can immediately see that we're dealing with a naked function, which prevents the compiler from adding instructions that take care of the function frame pointer at the beginning and end of the function. Thus, the function will contain only the assembly instructions we have embedded inside the __asm {} block and nothing else.
[plain]
__declspec(naked) HookRoutine() {
__asm {
pushad;
pushfd;
push eax;
call DebugPrint;
popfd;
popad;
jmp oldISRAddress;
}
}
[/plain]
The HookRoutine function basically stores and restores all the registers (including EFLAGS with pushfd) at the beginning and end of the function. In the middle of the function is where we can actually add our code, which will be executed every time an interrupt occurs. We're using only two instructions, the "push eax" and "call DebugPrint"; those instructions basically push the value stored in each onto the stack and call the DebugPrint function, which accepts the eax value as the argument. The DebugPrint function is very simple and makes only one call to the DbgPrint function by passing it the d parameter. We could have also programmed that in an assembly in the HookRoutine, but we choose this method simply because it's easier.
[plain]
void DebugPrint(UINT32 d) {
DbgPrint("[*] Inside Hook Routine - dispatch %d called", d);
}
[/plain]
Let's load the driver into kernel now; we've already seen that we can do that by using "OSR Driver Loader". At the same time we should also start the DebugView program, so we'll be able to see the messages being printed with DbgPrint. Once we've registered and started the service, which loads the driver into the kernel, the following will be printed into DebugView.
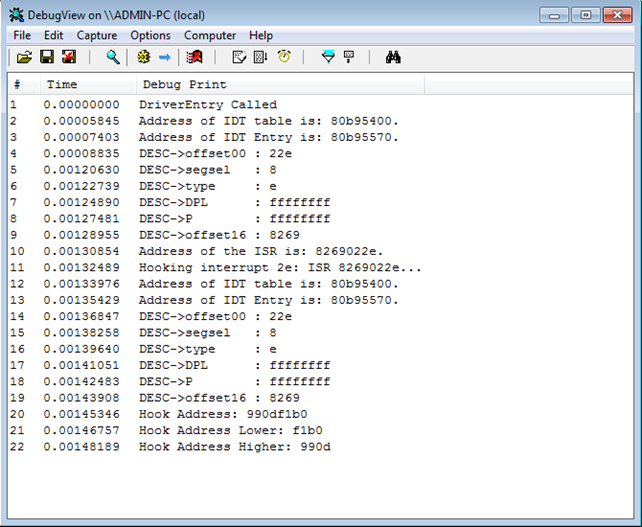
The last three lines are the most important: in line 20, we find out that the address of our HookRoutine is 0x990df1b0, which we're splitting unto two halves and printing each half. Once the driver has been loaded into the kernel and its DriverEntry function run, the IDT 0x2e entry is hooked. On the following picture, we can see the output of "!idt -a" command, where it's clearly seen that the 0x2e interrupt has a new address 0x990df1b0.

Let's also disassemble that function in WinDbg by using the u command. Below we can see the disassembled code, which is the same as we've written it. There are no "push ebp; mov ebp,esp; pop ebp, ret" instructions, which are normally present in a function – this is because we've declared the function as naked.
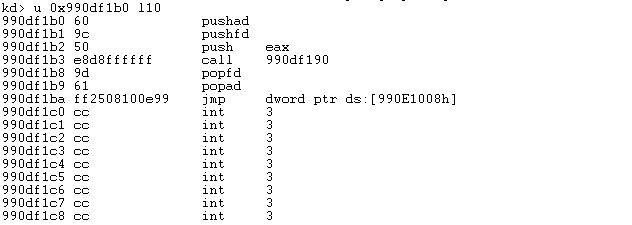
After we have hooked the IDT function, we can write another simple program interrupt.exe and compile it. The code of the program can be seen below and only triggers the 0x2e interrupt.
[cpp]
#include <stdio.h>
int main(void) {
__asm {
int 0x2E
}
return 0;
}
[/cpp]
Once we've compiled the program, we have to start it in the virtual machine with hooked 0x2e interrupt. When I did that, I stumbled upon an error, which can be seen below and was printed by using the "!analyze -v" command.
[plain]
kd> !analyze -v
*******************************************************************************
* *
* Bugcheck Analysis *
* *
*******************************************************************************
IRQL_NOT_LESS_OR_EQUAL (a)
An attempt was made to access a pageable (or completely invalid) address at an interrupt request level (IRQL) that is too high. This is usually caused by drivers using improper addresses. If a kernel debugger is available, get the stack backtrace.
Arguments:
Arg1: 00004350, memory referenced
Arg2: 000000ff, IRQL
Arg3: 00000001, bitfield :
bit 0 : value 0 = read operation, 1 = write operation
bit 3 : value 0 = not an execute operation, 1 = execute operation (only on chips which support this level of status)
Arg4: 8271058e, address which referenced memory
Debugging Details:
------------------
WRITE_ADDRESS: 00004350
CURRENT_IRQL: 2
FAULTING_IP:
nt!vDbgPrintExWithPrefixInternal+111
8271058e ff8760350000 inc dword ptr [edi+3560h]
DEFAULT_BUCKET_ID: VISTA_DRIVER_FAULT
BUGCHECK_STR: 0xA
PROCESS_NAME: interrupt.exe
TRAP_FRAME: 9c16aa74 -- (.trap 0xffffffff9c16aa74)
ErrCode = 00000002
eax=00000008 ebx=000001ff ecx=9c16ab1b edx=9c16ab1d esi=00000000 edi=00000df0
eip=8271058e esp=9c16aae8 ebp=9c16ad3c iopl=0 nv up di pl zr na pe nc
cs=0008 ss=0010 ds=0023 es=0023 fs=003b gs=0000 efl=00010046
nt!vDbgPrintExWithPrefixInternal+0x111:
8271058e ff8760350000 inc dword ptr [edi+3560h] ds:0023:00004350=????????
[/plain]
If I execute g command to run the virtual machine despite the problem, a blue screen of death occurs.
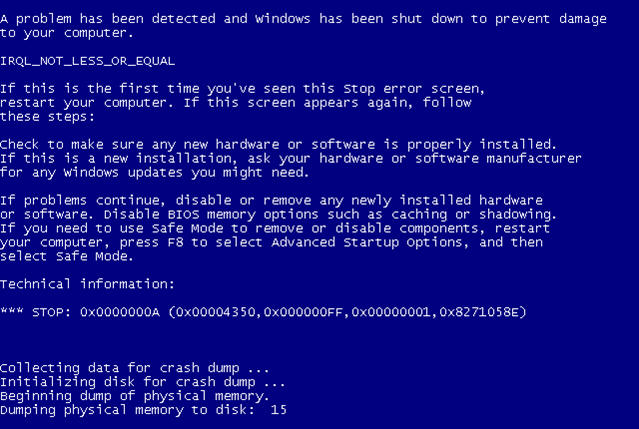
We can see that our driver was able to crash the whole system. This happens because we're playing in kernel mode now, where a mistake can be deadly. The problem means that our driver accessed the paged memory at too high an IRQL level. IRQL is used to disable certain interrupts in the system, which are sometimes called Interrupt ReQuests (IRQ) with a priority level IRQL. The picture below presents the IRQLs as defined in Windows NT [5].
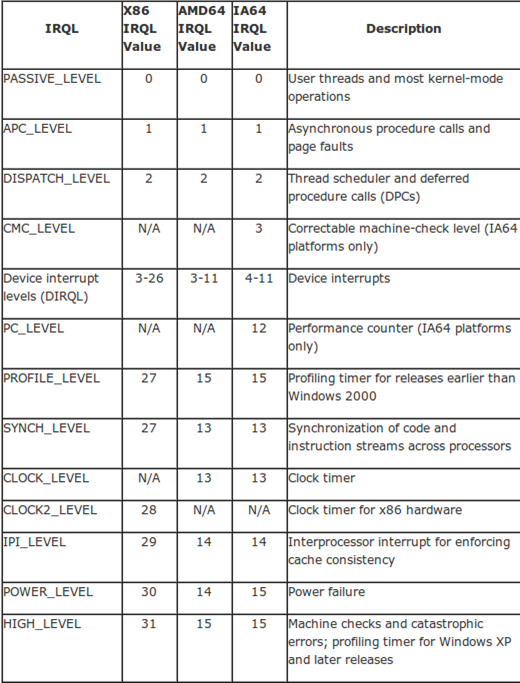
When a processor executes code on certain processors under certain IRQL level, that code can only be interrupted by the code with higher IRQL level; interrupts with smaller IRQL level are temporarily disabled. We need to be executing code under PASSIVE_LEVEL, where the user-mode code and most of the kernel-mode operations are executed. We've gotten the blue screen of death because we're trying to execute code under DISPATCH_LEVEL, which is a too-high IRQL. We can run the KeLowerIrql function to lower the IRQL to PASSIVE_LEVEL, which would enable us to run our defined function normally.

To prove a point, I commented-out the call to DebugPrint from HookRoutine, after which the crash didn't occur anymore. I recompiled the driver, restarted Windows and loaded the driver into kernel again. At that time, the address of the HookRoutine is 0x988e5190 as can be seen below.

I also put a breakpoint on that address by executing the "bp 0x988e5190" instruction. The bl instruction is used to list the current breakpoints, where there's only one set on the 0x988e5190 address.

Then I run the interrupt.exe program in a console as can be seen below.

At that point the breakpoint was hit and the WinDbg took over Windows execution. The picture below presents how the breakpoint is hit.

To be able to call DebugPrint in HookRoutine, we have to add KeLowerIrql at the beginning of the HookRoutine function as follows. That ensures that we're setting the current IRQL at the right level, so we're able to injected kernel-mode code.
[plain]
__declspec(naked) HookRoutine() {
KeLowerIrql(PASSIVE_LEVEL);
__asm {
pushad;
pushfd;
push eax;
call DebugPrint;
popfd;
popad;
jmp oldISRAddress;
}
}
[/plain]
Once we've recompiled the driver and loaded in into the kernel, we can run interrupt.exe again. This time, the program will not crash the whole system and the DebugPrint will actually print the message informing us that the hook routine was called. We can see the message printed in WinDbg below.

This makes the sample application complete and ensures that we can run arbitrary code inside kernel-mode.
Conclusion
In this article we've seen that hooking the IDT table is quite easy, we just need to understand how the interrupts work within the Windows operating system. We've written a kernel driver that hooked the interrupt service routine of the 0x2e descriptor. By doing that, upon every triggered 0x2e interrupt, our HookRoutine functon is called, which further calls the original interrupt service routine. But before doing that, we have a change to execute our own code in kernel-mode with highest privileges. We've also seen that making a mistake at that level can result in a crash of the whole operating system, which is a standard practice when developing code at the privileged level.
At this point we should also emphasize that interrupt hooking is easy to detect. This is true because the pointer of 0x2e interrupt should point to the KiSystemService routine, which should be located somewhere inside the ntoskrnl.exe module. When overwriting the interrupt with a pointer to our own module, this isn't true anymore, which makes this technique easy to detect. The int 0x2e interrupt is used only in older operating systems; nowadays, the more effective sysenter method is used for system calls to call from user-mode to kernel-mode.
Learn Web Server Protection


