Threat Hunting for Swells in Database Read Volume
Introduction
When attackers have breached your network, one of the most common things they will be doing is looking into your systems that have sensitive data. This data is often kept on databases making them a big old bullseye for hackers who have gained entry. This article will detail how to threat hunt by looking at Database Read Volume on your network. Hopefully, you are not currently facing an attack at your organization, but if you are and you are not sure how to begin investigating the attack – let this article be your guide.
Cybersecurity interview guide
Indicators of Compromise
Indicators of Compromise, or IoCs, are pieces of forensic data that Information Security professionals can use in their threat investigations. Following IoCs to the threats is similar to following a breadcrumb trail to someone who has stolen bread. You must look closely at what you are seeing (data-wise) and from all angles, and if you do, then you have a good shot at tracking down the threat.
Swells in Database Read Volume are a dead giveaway that a threat has breached your network. Once they are in your network, they will leave signs that they have been messing around in your data stores. These signs are likely not just small clues but rather huge, massive spikes in read volume that far exceed what you normally see. This is especially true for databases that contain credit card information – the attackers know what they are looking for and have ten ways ‘til Sunday to help them get it. When attackers begin extracting data, you will see the database read volume jump even higher.
How to Threat Hunt for Swells in Database Read Volume
Just as a thief will leave tracks, so will the attacker or attack vector. With that said, the question is – where do you start looking? Threat Hunting is not as much a science as it is an art. Your threat hunting tactics must adapt to the specific attack or situation that you are dealing with and there is no one good way to conduct a threat hunting investigation.
The first place a threat hunter should begin looking for swells in database read volume is on the database itself. This is accomplished through a process called database auditing. Simply put, database auditing is a facility to track the use of database authority and resources such as data. Once auditing is enabled, each audited database operation leaves an audit trail of information including which database object was changed, who performed the change and when the change was performed. Whenever someone changes a file, deletes a file, adds a file, or even simply reads a file on a database the log will record the user who was involved. This will be of particular interest to threat hunters because not only can you see the increased volume of database reads but you can also see the account which was doing the reading. You may even be able to find out which user account was compromised giving access to the network if that was the case in your situation.
With that said the first step is to enable auditing on the impacted database. You can easily find out if auditing is enabled on the database via SQL*Plus. If it is not enabled, you will see the following:
SQL> connect / as sysdbaConnected.
SQL> show parameter audit_trail
NAME TYPE VALUE
----------- ----------- -----
audit_trail string NONE
Here, since the value is set to ‘NONE’ you can clearly see that that database auditing is not enabled. If it is not, change the value to ‘DB’, restart the instance and then verify that the change took. If it did you should see something like this:
NAME TYPE VALUE----------- ----------- -----
audit_trail string DB
Also, verify that your connection auditing has been enabled. If it is not, tell the database that you want to enable connection auditing and you should see something like this:
NAME TYPE VALUE----------- ----------- -----
audit_trail string DB
Great! You have just enabled auditing on the impacted database and you can now perform in-depth threat hunting analysis of access patterns, including database read volume, and can get a great start on your investigation.
IOSTAT
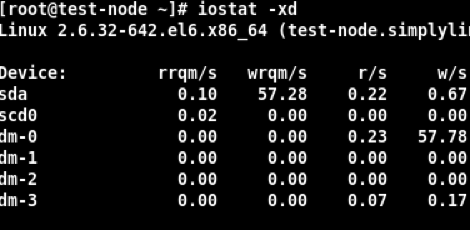
So, let’s say that you suspect your environment is being attacked and you need to investigate this IoC. Now. You don’t have time to comb through logs or perform hours of analysis. To make matters worse, you think it may be on your SQL Server which hosts your main databases. To investigate, use the IOSTAT command. This SQL command allows you to see Disk I/O and includes the read and write loads of the database. To see a more useful expression of read volume load, such as reads per second, you will need to see extended statistics. Use the following expression: iostat -xd. The third column in the result generated, r/s, will show you reads per second. Let’s say your baseline normally looks like this:
This shows a read per second of .22. Now, after suspecting an attack and checking extended statistics, you see the following:
You can clearly see a major swell in database read volume. This was fast and easy, and now you know that your SQL server is under attack allowing you to stop or at least mitigate the attack.
References
https://www.darkreading.com/attacks-breaches/top-15-indicators-of-compromise/d/d-id/1140647
http://tdan.com/database-auditing-capabilities-for-compliance-and-security/8135
http://tdan.com/database-auditing-capabilities-for-compliance-and-security/8135
Learn Vulnerability Assessments


