Threat hunting with Graylog
Introduction
Graylog is a leading centralized log management solution which allows security teams to log, store and analyze huge amounts of data. One area where Graylog especially shines is in its analysis speeds. In this article, we’ll discuss how Graylog can be used to analyze data in a hypothetical threat-hunting scenario.
Learn Network Traffic Analysis for Incident Response
Overview
We set up Graylog, elasticsearch and mongo-db on an Ubuntu 18.04 virtual machine. We won’t be discussing the initial set-up; however, if that is of interest, the procedure can be found here.
In our scenario, an internal rogue employee attacks one of our production servers to gain unauthorized access through brute-forcing our SSH and FTP services. Using this premise, we’ll discuss how Graylog stores the logs and displays them and how we can implement various features in the open-source version during analysis.
Attack scenario
We recently discovered a breach attempt on one of our company’s production servers. Unbeknownst to the attackers, we had our Graylog instance installed within the same server, which allowed us to monitor their attempts at unauthorized access. The attackers were discovered to have performed numerous brute-force attacks against the FTP and SSH services on our server and had managed to gain access to our server. We had previously configured the server to send logs to Graylog through rsyslog.
Below is an analysis of how we discovered this by using the Graylog Open Source log management solution.
The Analysis
When we logged into our production server and accessed our Graylog Web view, we discovered that some new logs had come in and decided to take a look at them. We did this by clicking on “Show received messages” on the Web interface, as shown below:
We discovered multiple attempts at bypassing our FTP and SSH logins. According to the logs, the attacker was based within our network; therefore, we started treating this as an internal attack. Had we discovered multiple service attacks, we would have simply made use of Graylog’s search functionality, as demonstrated here.
From the screenshot below, we were able to identify the remote attacking host and the usernames attempted during the breach. For instance, line four below shows an attempted username as “administrator” and the remote host (attack source) as “192.168.100.2”.
A similar thing was discovered to be true for the SSH service:
The remote host is logged as well as the service which the attacker tried to log into. If we wanted, we could have configured extractors to format the manner in which these messages appear, but in our case we left the defaults going.
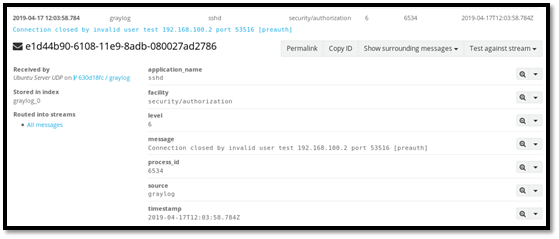
Graylog allowed us to access granular information for each alert logged. For instance, drilling down to one failed SSH log is shown below:
We can see more information here that allows us to better understand this particular log. The message here describes the log. From the above, we can see that the login attempt failed, along with the exact timestamp when this was noted.
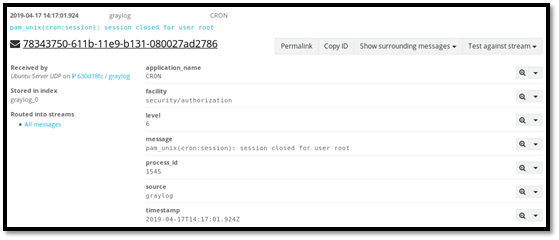
We also discovered that the attacker created a malicious cron job to execute after certain time thresholds were met, to perform network scans within our internal network. Below is a log file generated after the cron job had executed.
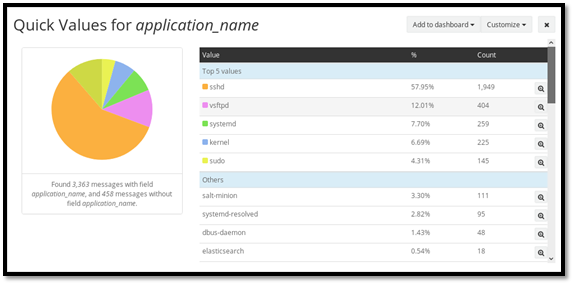
We took a closer look at the rest of the logs by clicking on “application_name” on the left of the web view of Graylog and selecting “Quick values.” That allowed us to view a summary of the logs in a chart view as shown below:
We noticed that we took a major hit on SSH brute-force attempts, with those having the highest log count of 1949 and total percentage value of 57.95%.
We also discovered that the attacker had, in one way or another, managed to gain access to another server (our salt-master control server). This effectively stopped any messages from this production server from reaching the salt master. We discovered this from failed connection attempts to the salt master by the production server (salt minion), as can be seen above in the section labeled “Others.”
Graylog allowed us to discover the time when we suffered the most attacks by generating a time graph, as shown below. In some instances and depending on your setup, you might have attacking IP addresses from various global sources around the world. Graylog allows you to configure geolocation, where you are able to use the resulting logs to build a map that you can even use within your reports.
There are various representations we could choose from. Above is a bar graph and below is a line graph showing an overview of our logs with time.
We were able to use Graylog to categorize all these attacks by time in a more detailed view, as is shown below.
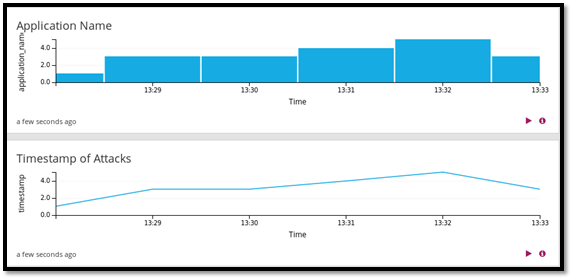
We discovered that while these attacks took less than an hour to execute, the possibility of the attacker implementing automated tools as well as executing the attack manually was a reality. We created a dashboard within Graylog to allow us to monitor the time of attacks more easily.
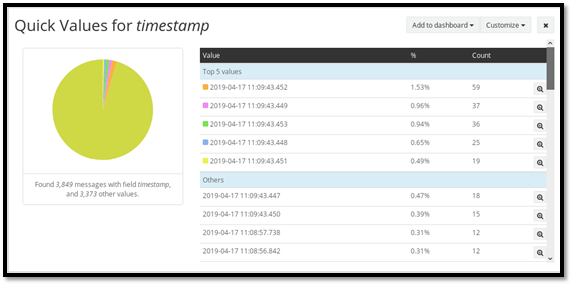
We decided to add graphs of the timestamps of attacks and application name to the dashboard. This is shown below.
We were able to monitor system performance to ensure that the server was performing as we would expect it to. A summary of the node can be seent below, as obtained from the Web view.
Graylog also supports streams, which are real-time alerts that are more reliable than the normal searches that you would perform.
The following is a summary table we created that summarizes the attack scenario and threat-hunting exercise:
Conclusion
Graylog is one of the most common log management solutions available today. The tool is wide-ranging in its ability to manage and assess logs, and the marketplace ensures that users can greatly expand its functionality by adding in plugins and getting solutions to common problems. The ability also to also integrate with tools such as firewalls, SIEMS and IDSes also ensures that threat-hunting teams operate at optimum productivity.
Learn Web Server Protection
In this article, we’ve only covered a fraction of the tool’s uses. More on Graylog can be found in the documentation here.
Sources
- Welcome to the Graylog documentation, Graylog
- Graylog Series Part 1 - install and import some logs, GrumpyoldIT (YouTube)
- Graylog Marketplace, Graylog


